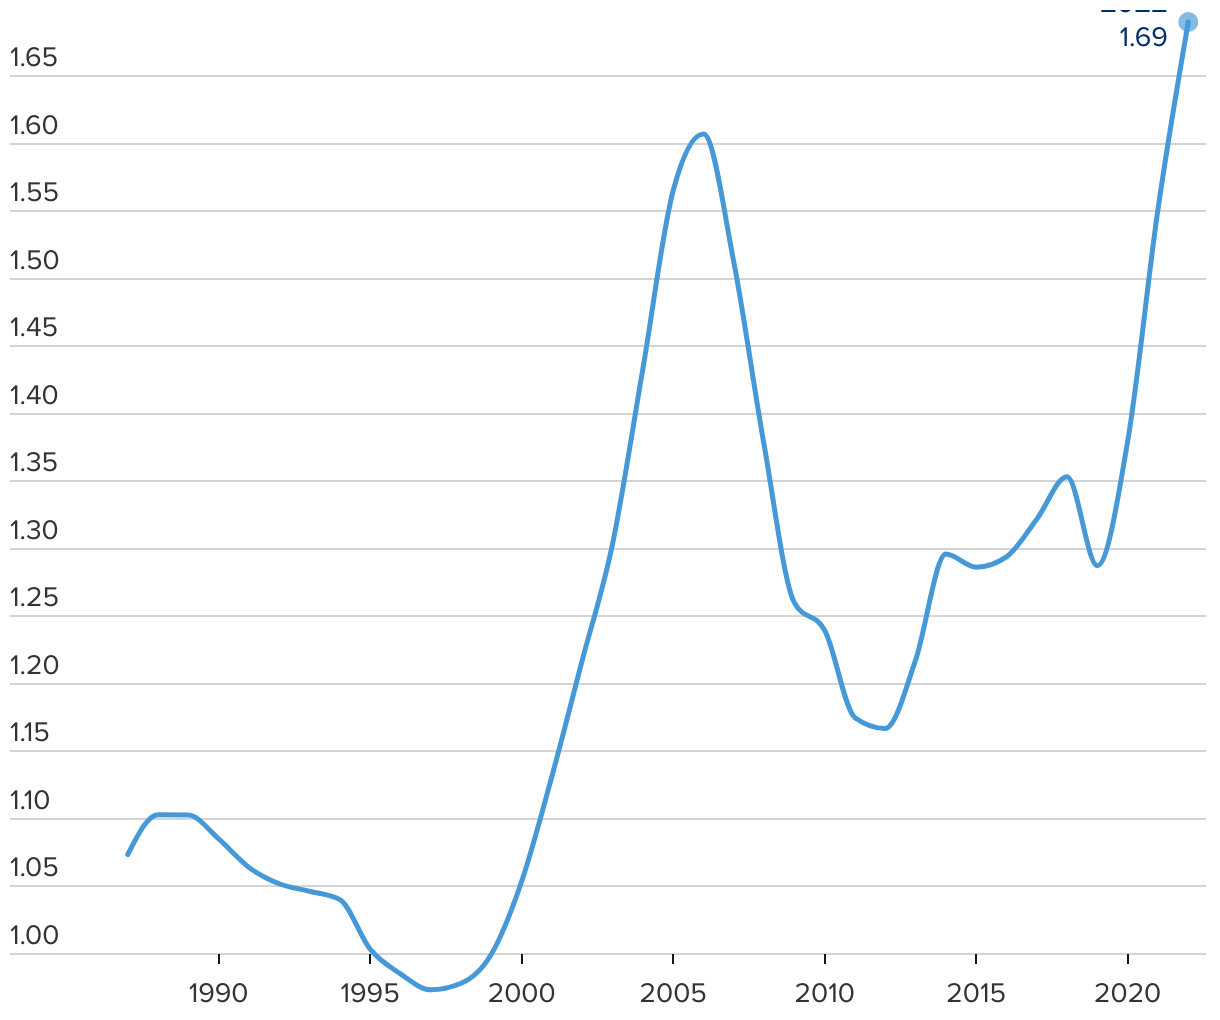
U.S. home prices and household income
Ratio of S&P/Case-Shiller U.S. National Home Price Index to U.S. median household income
The line chart shows the ratio of the S&P/Case-Schiller U.S. National Home Price Index over U.S. median household income from 1987 through 2022.