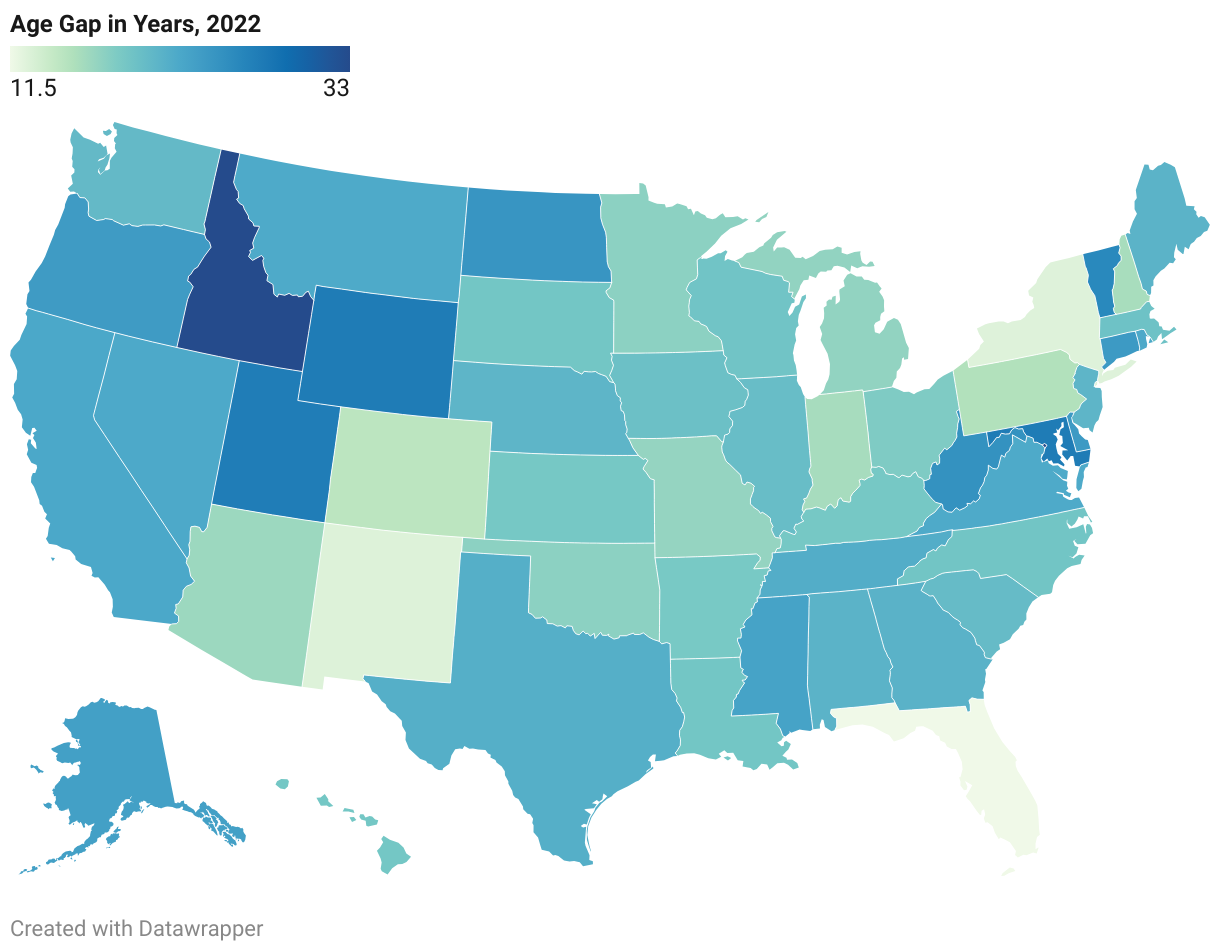
The interactive US map shows the difference between the average age of each state's representatives and the median age of its residents. The colors of each state range from light green, which signifies a smaller age gap, to dark blue, which signifies a larger age gap.
How Old Is Your Representative?
This map shows the difference between the average age of each state's representatives and the median age of its residents.