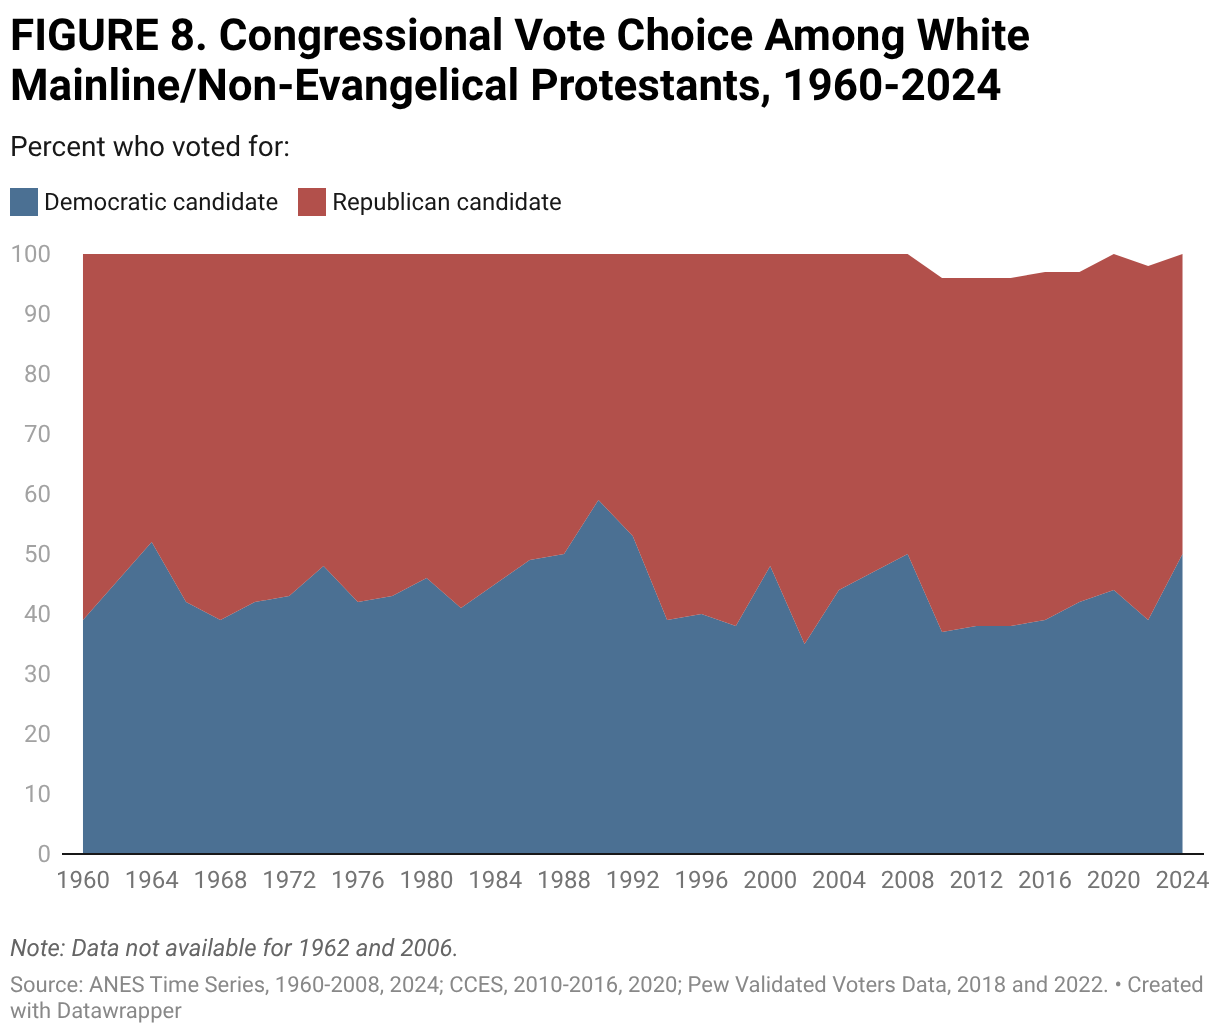
Percent who voted for:
(Please use a modern browser to see the interactive version of this visualization)