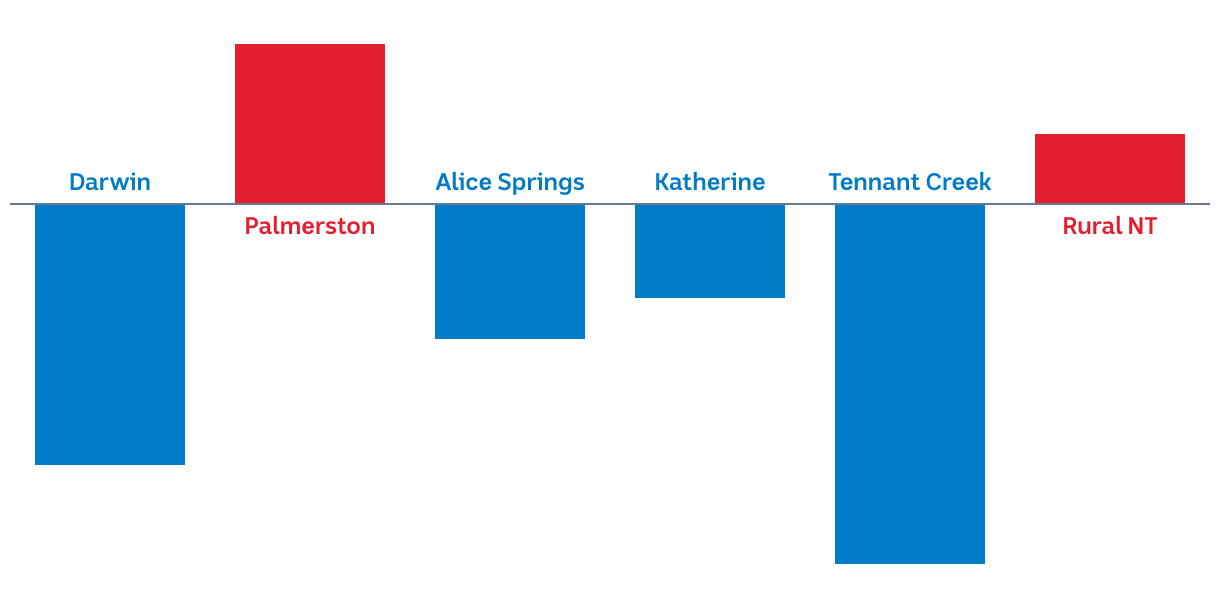
Property crime offences decrease in some parts of the NT
Year-on-year changes, expressed here as percentages, show the rate of property crime across different parts of the NT.
A chart shows offending rates fluctuating in different parts of the NT.
Year-on-year changes, expressed here as percentages, show the rate of property crime across different parts of the NT.