Requests to exclude wildfire smoke from regulation are increasing
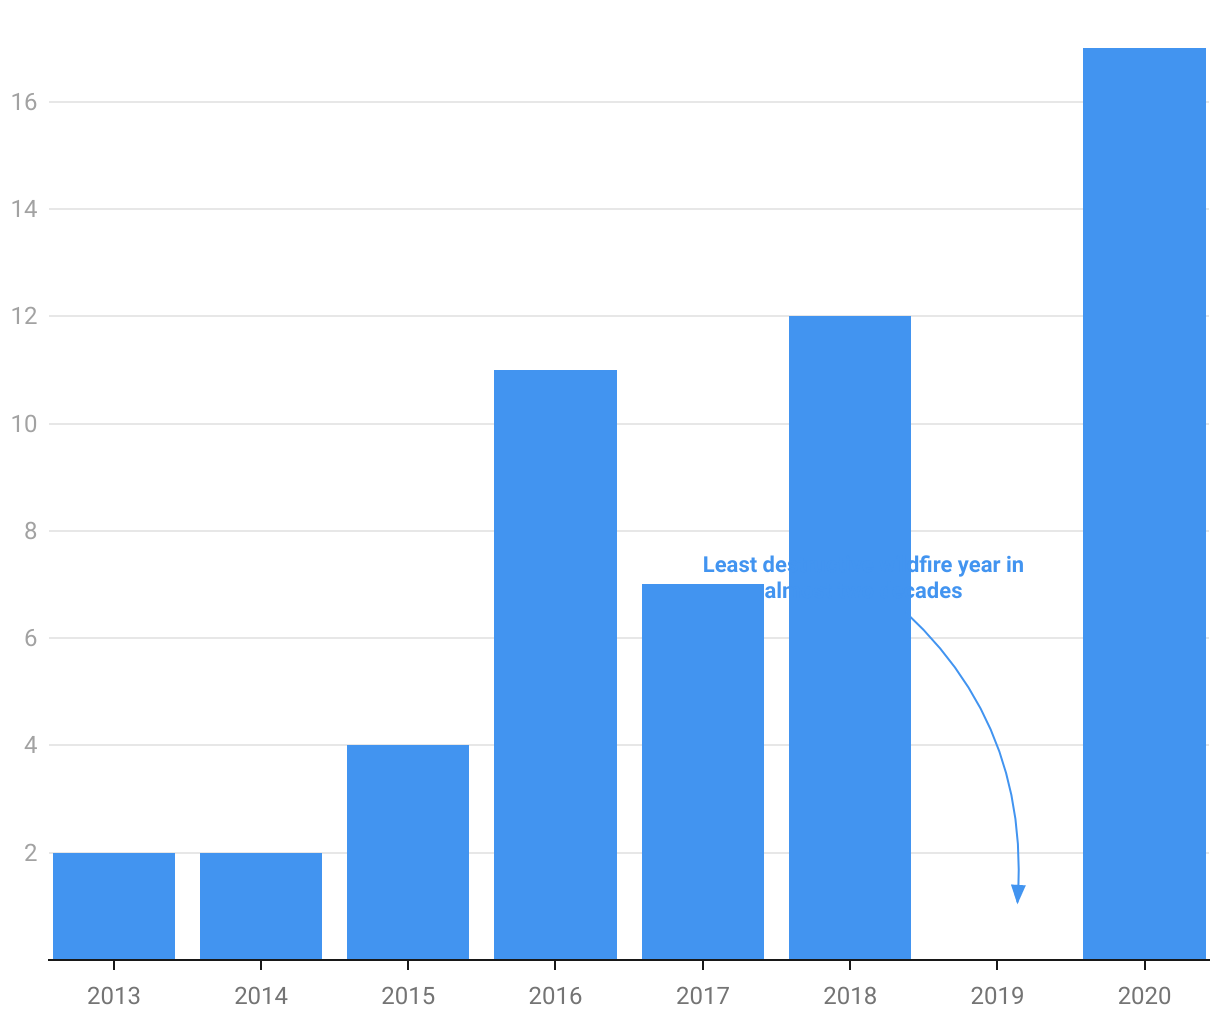
The number of exceptional event submissions for wildfire smoke reached a new high in 2020 after years of increase since the EPA first started tracking submissions in 2013.
Bar chart with white background shows blue bars trending taller each year from 2013 to 2020 with the exception of 2019, which has no blue bar. The bars show an increase in the number of exceptional event submissions to the EPA each year. A note for 2019 clarifies that the year was the lowest wildfire season in almost two decades.