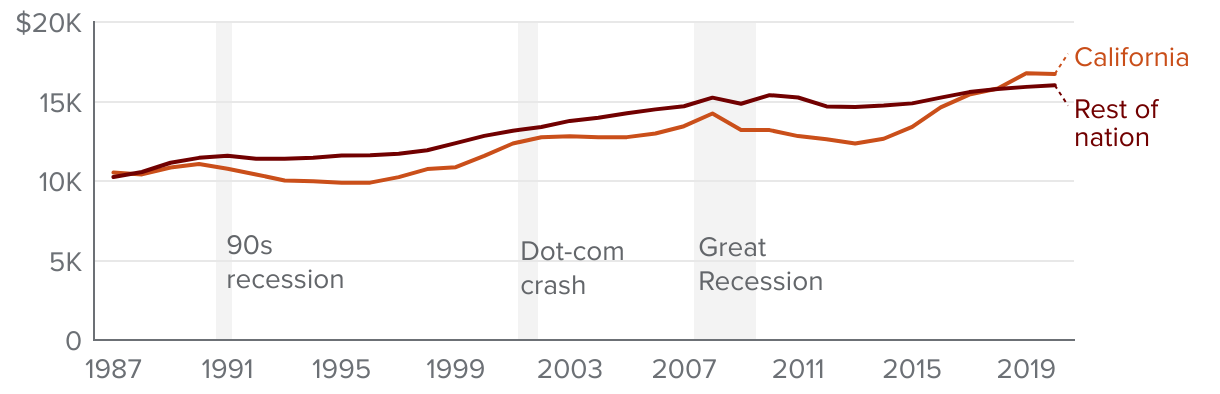
California school spending has been above the national average since 2018–19

Current expenditures per student from 1986–87 to 2019–20 (in July 2023$)
Rest of the nation   West coast   Most populous   Top 5   Bottom 5  

SOURCES: Common Core of Data, National Center of Education Statistics; Authors’ calculations. NOTES: Annual expenditures per student, adjusted for inflation (July 2023$). At the time of publication, 2019–20 was the most recently available year. “Rest of the nation” includes all states and Washington DC, and excludes CA. Average for “Rest of the nation” weighted by state enrollment, representing average spending for a student attending public K–12 outside of CA. "West coast" includes Oregon and Washington. "Most populous" are states with the largest populations. "Top 5" and "Bottom 5" are the states with the highest and lowest spending per student in 2019–20. Year shown is fiscal year (e.g., 2020 = 2019–20). FROM: PPIC Blog, September 2024. Get the data Embed