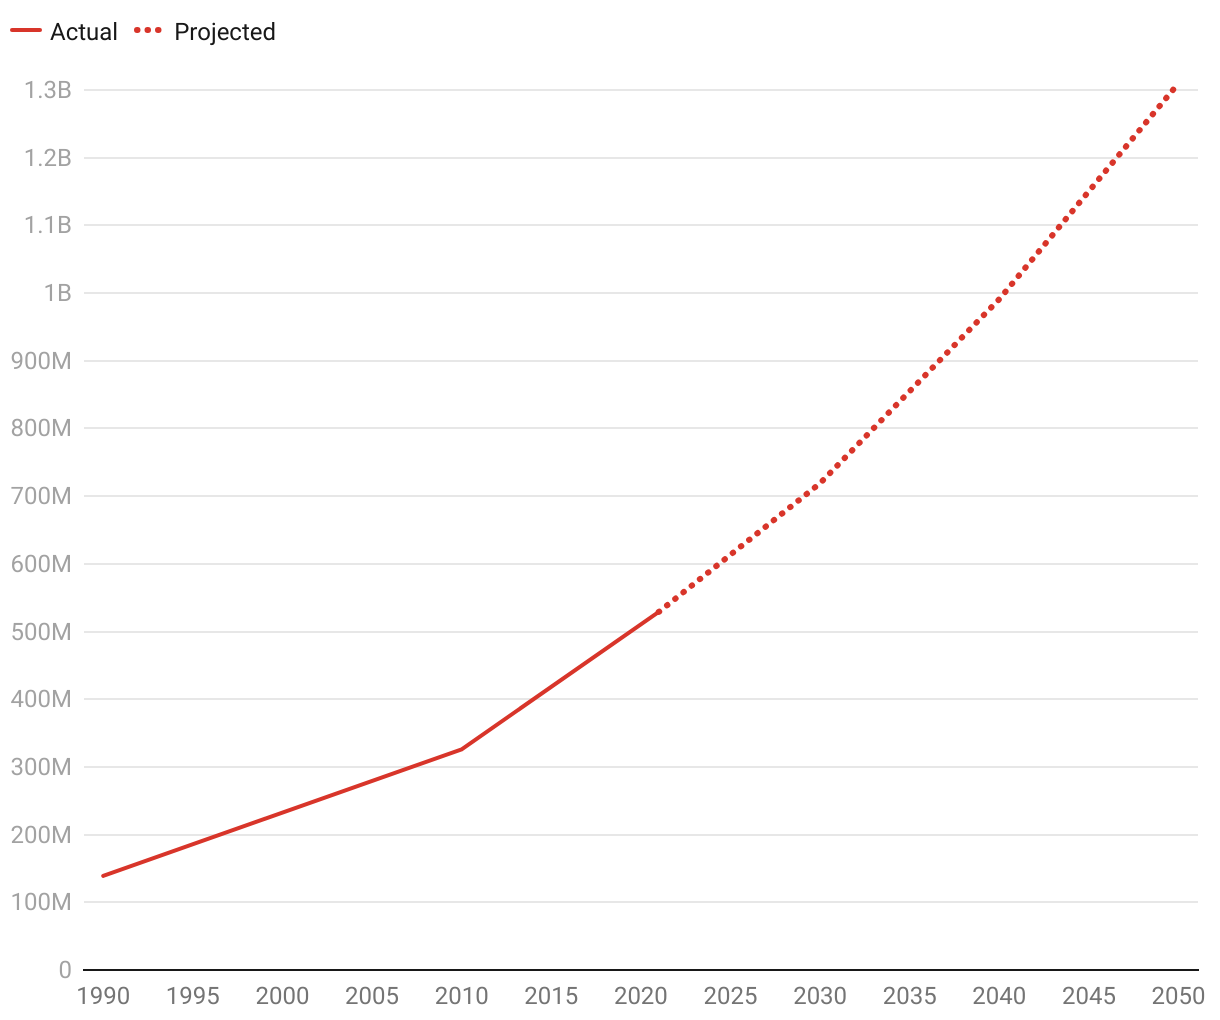
Global diabetes cases rising, set for faster increase
Since 1990, the first year analyzed in the study, global cases of diabetes have been on the rise. These numbers are projected to increase even more steeply through 2050.
A line chart where the actual number of cases of diabetes climbs from 1990 through 2020 and then is projected to climb more steeply through 2050.