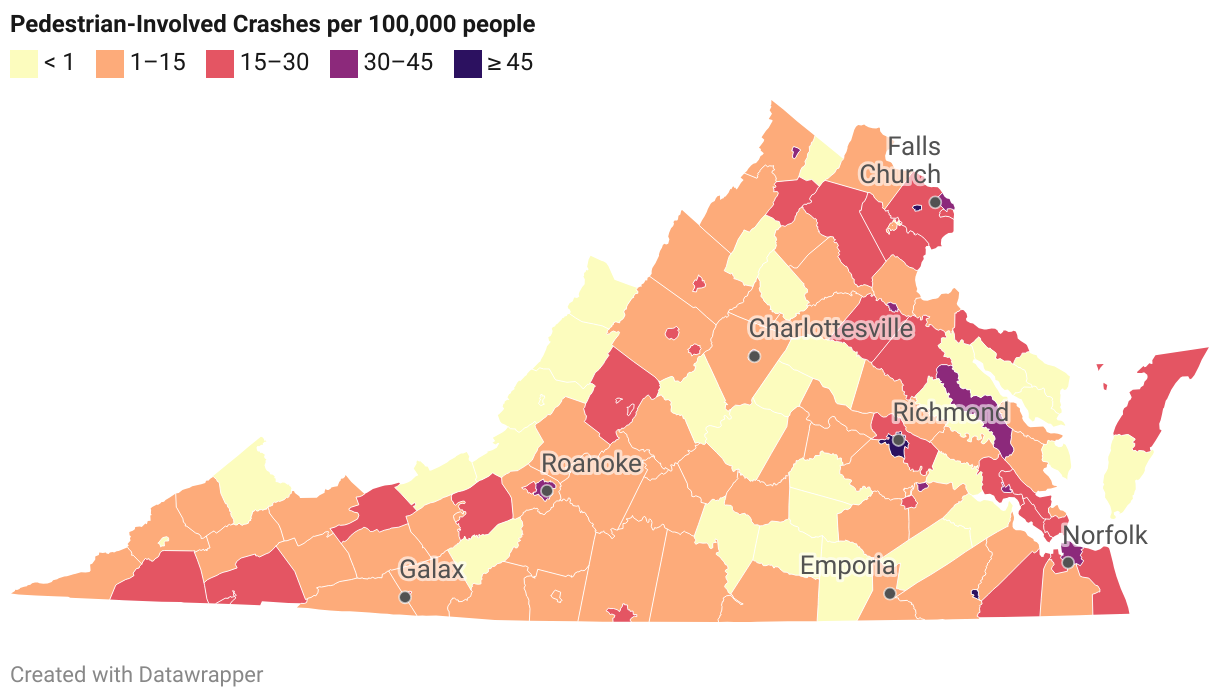
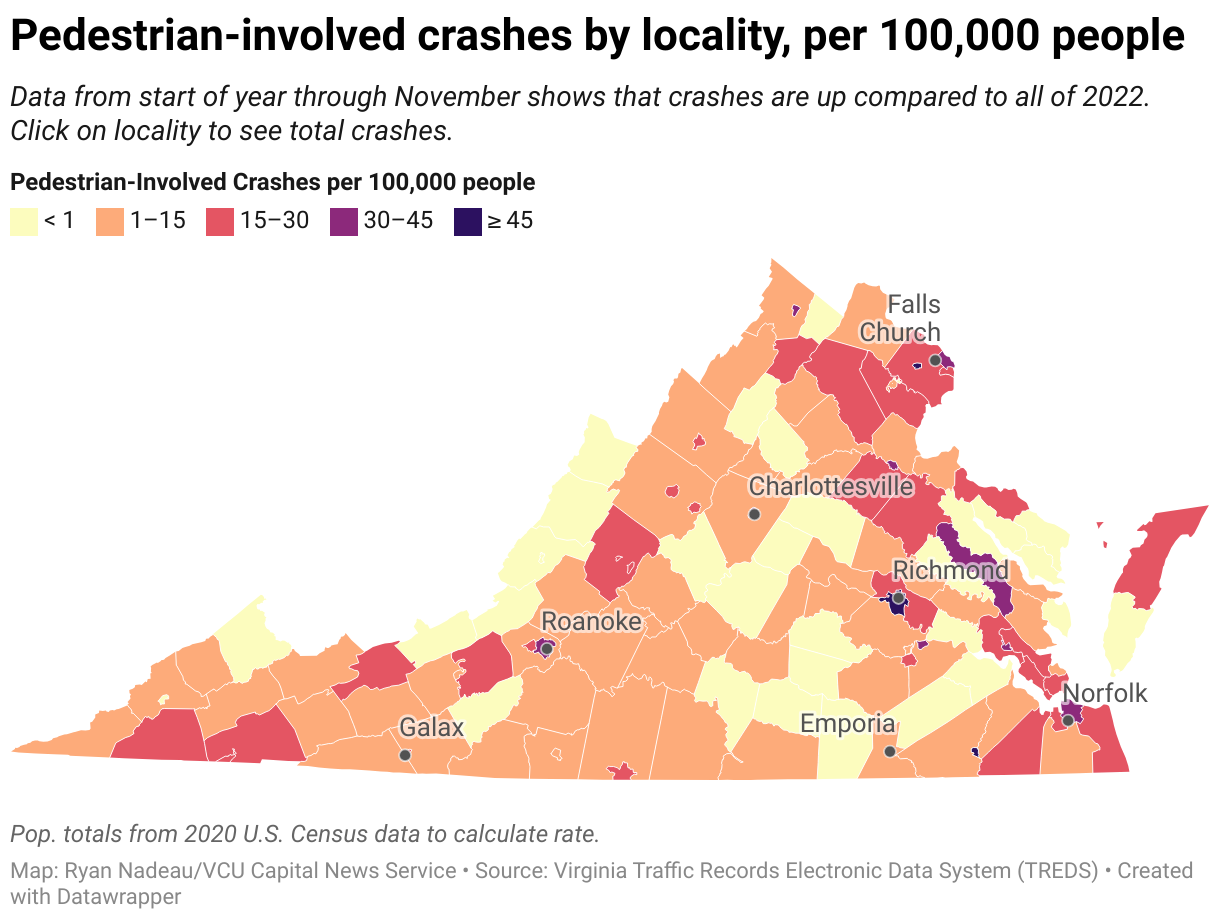
Pedestrian-involved crashes by locality, per 100,000 people
Data from start of year through November shows that crashes are up compared to all of 2022. Click on locality to see total crashes.
Data from start of year through November shows that crashes are up compared to all of 2022. Each locality on maps is represented by a color range showing total crashes and crashes per capita.