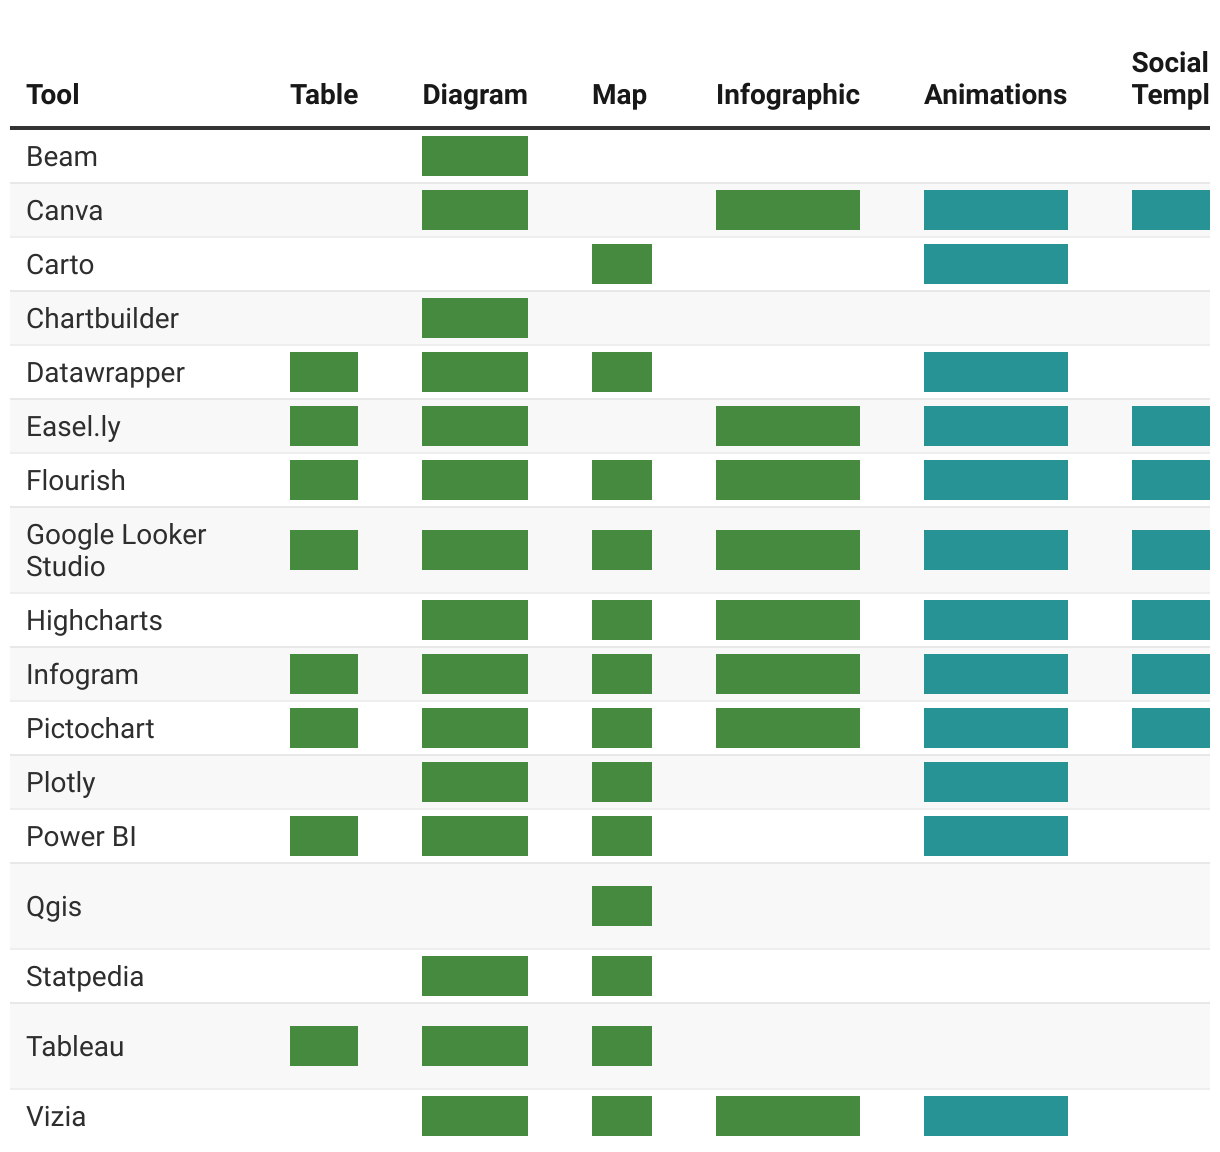
Chart type (green), features (turquoise) and installation (blue)
(Please use a modern browser to see the interactive version of this visualization)