Accounting for Enrollment, Great Recession's Scars Lingered on Public Education in Some States
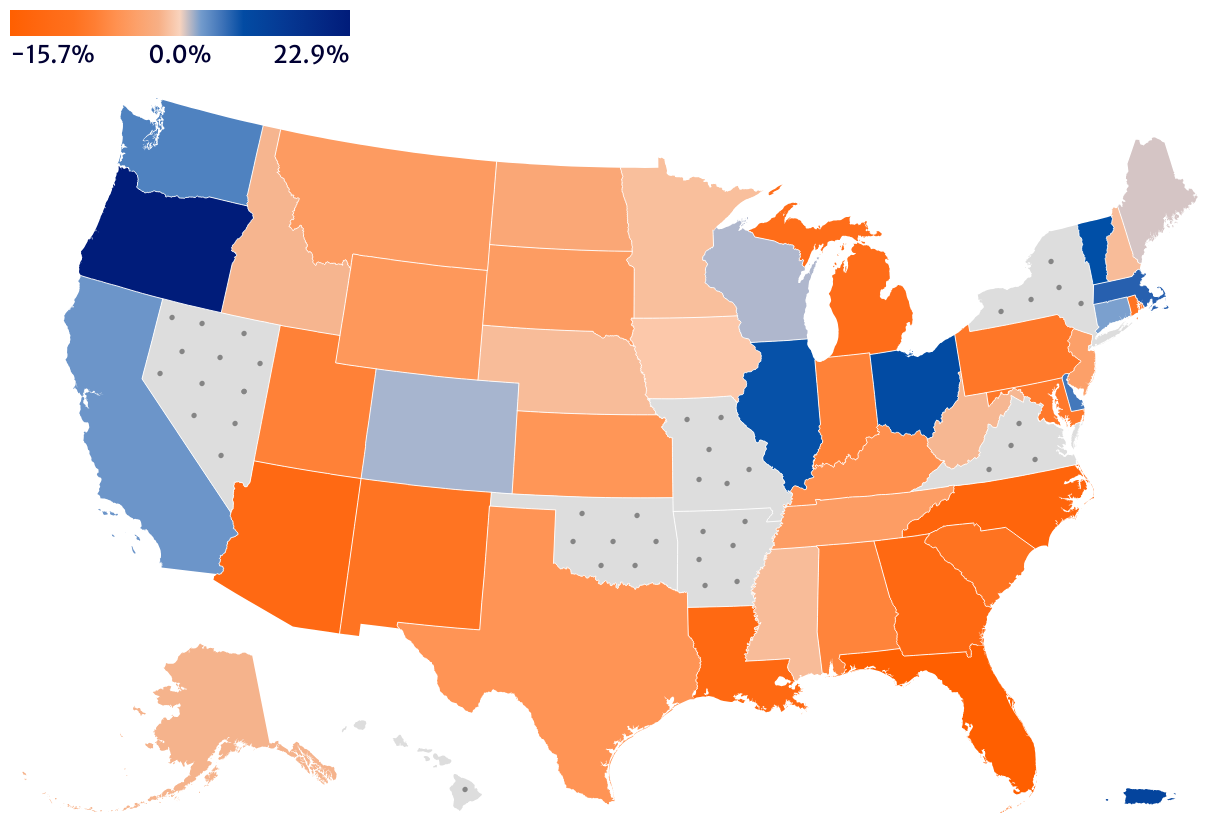
Percent Change in State and Local Government Employment, Adjusted for Public Elementary and Secondary School Enrollment, 2008–2019
This figure, Figure 8, shows the enrollment-adjusted percent change in local government education between 2008 and 2019 by state and territory. States and territories that experienced an increase in enrollment-adjusted employment in local public education are shown in shades of blue, with darker shades indicating a higher percent change. States and territories that experienced a decrease in enrollment-adjustment local public education employment are shown in shades of orange, with darker orange indicating a greater percent decline. States with missing data are shown in gray with dots; these include Arkansas, District of Columbia, Hawaii, Missouri, Nevada, New York, Oklahoma, and Virginia. Enrollment data was available for 43 states and Puerto Rico. Of these, 13 had enrollment-adjusted positive growth in their local public education workforces, while 31 saw enrollment-adjusted declines in local public education employment. Adjusting for K–12 enrollment levels, changes in local education employment ranged from just under 23 percent growth in Oregon to a nearly 16 percent decline in Florida. Local education workforces, after accounting for state changes in enrollment, were short by over 10 percent in six states: Michigan (-11.2 percent), Arizona (-12.4 percent), Louisiana (-12.7 percent), Georgia (-12.7 percent), North Carolina (-13.8 percent), and Florida (-15.7).
Source: Authors' analysis of State and Area Employment, Hours, and Earnings data, US Bureau of Labor Statistics, 2008–2019; and US Department of Education, National Center for Education Statistics, Common Core of Data, "State Nonfiscal Survey of Public Elementary/Secondary Education," 2008 through 2020–21.