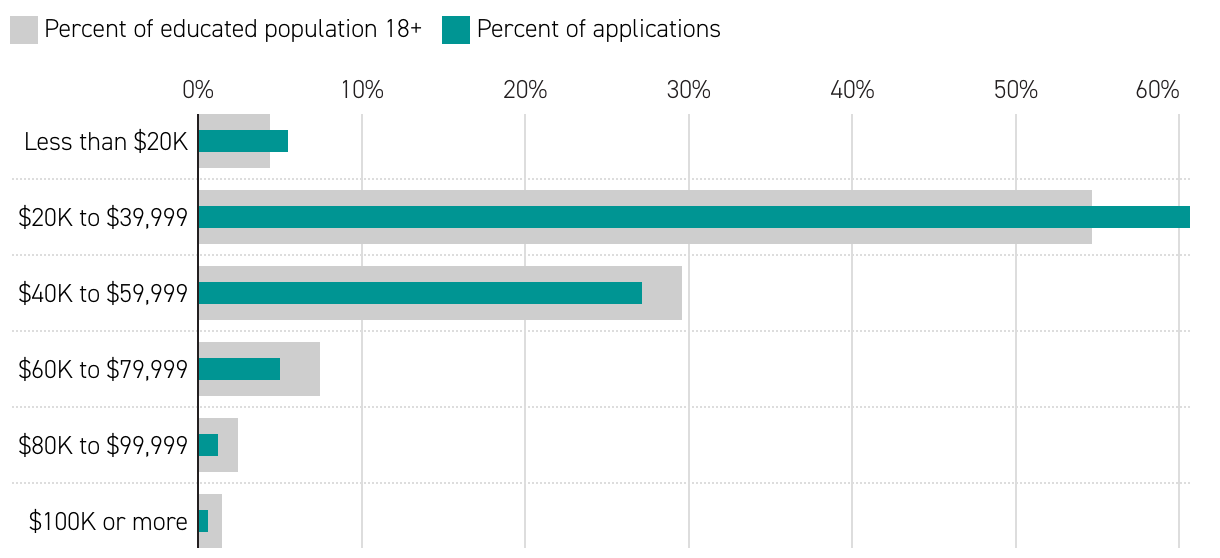
Lower-income ZIP codes overrepresented in student loan forgiveness applications
Percent of all applications and percent of all U.S. adults with some college education within ZIP code tabulation areas*, by mean income
This is a bullet bar chart showing the relationship between the college-educated adult population and the number of loan forgiveness applications. Zip code tabulation areas are grouped by per capita income. Neighborhoods where the per capita income is less than $40,000 were overrepresented in total applications, while neighborhoods where the income was more than $40,000 were underrepresented.