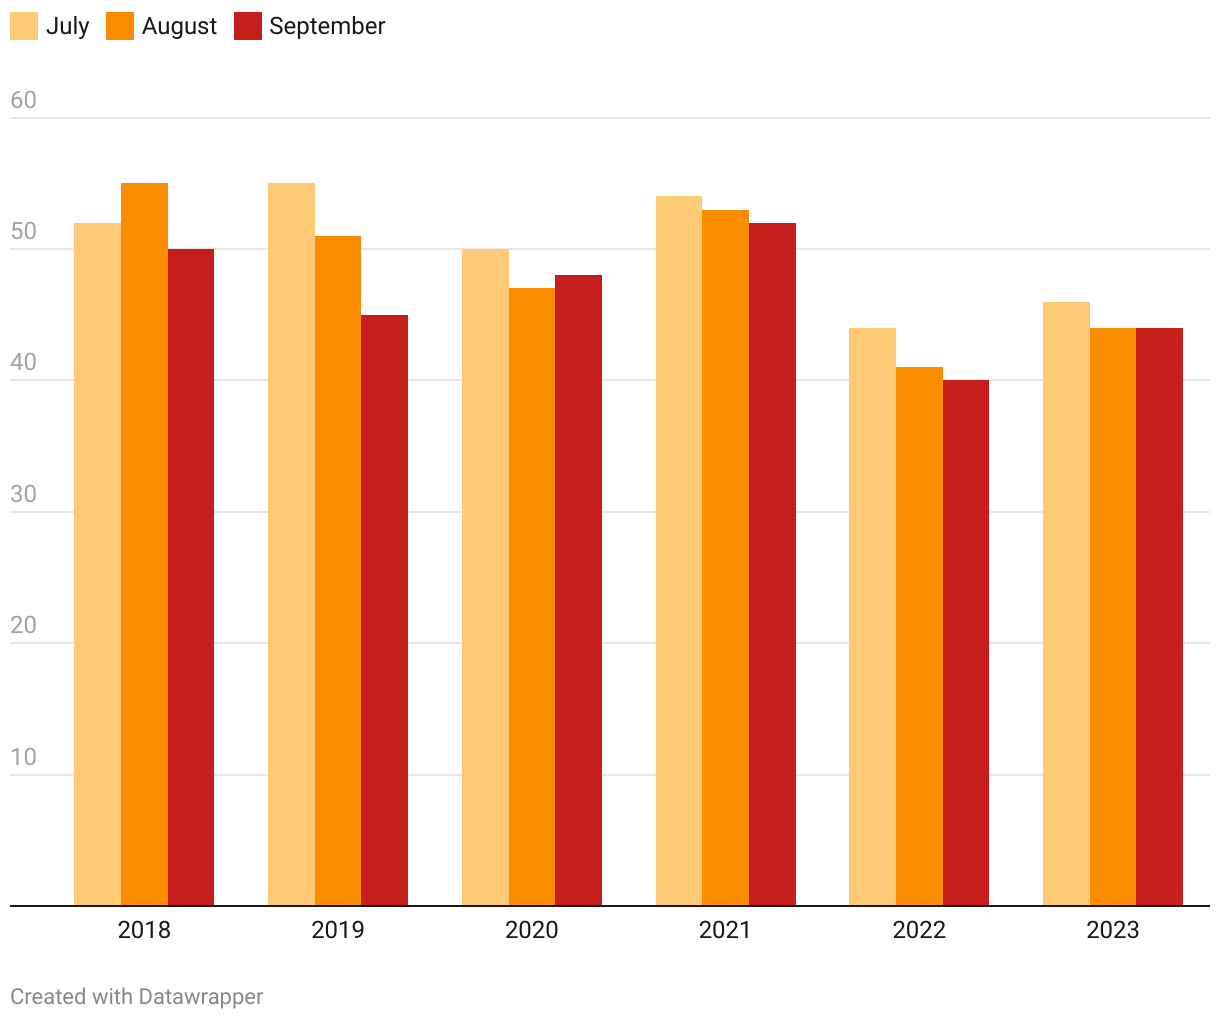
Column chart showing how levels of optimism have changed, each summer since 2018. Apart from 2018, they have declined each year in August.
Overall optimism, July-September since 2018
Index 0-100. Scores above 50 indicate that the majority of the population are optimistic about the future.