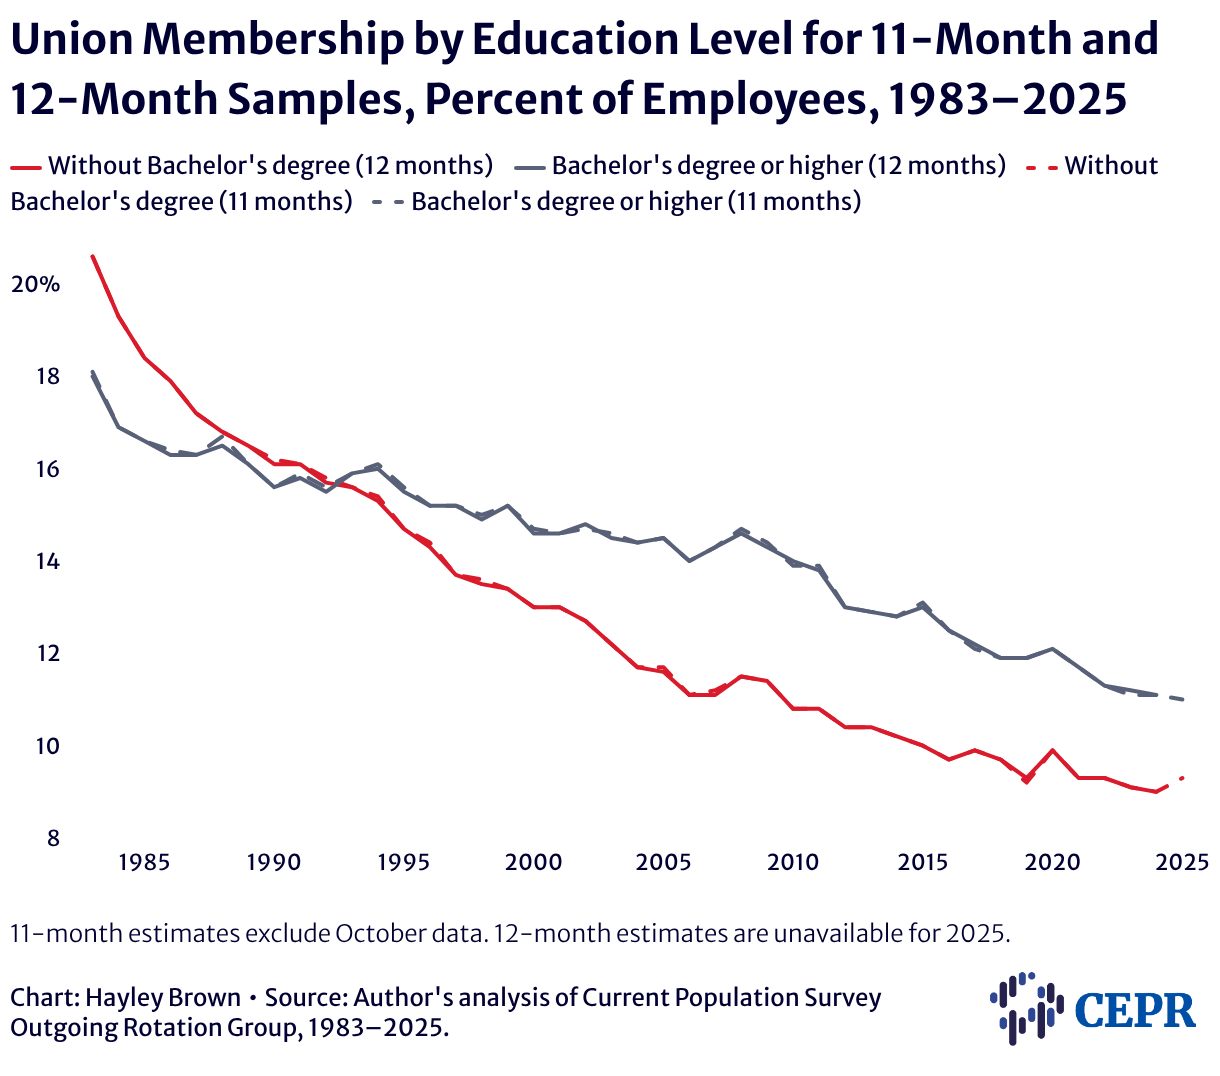
Union Membership by Education Level for 11-Month and 12-Month Samples, Percent of Employees, 1983–2025
Line chart comparing union membership rates by education using 12-month (solid) and 11-month (dashed) samples from 1983 to 2025. Workers without a bachelor’s degree are red and those with a bachelor’s degree or higher are gray. The two samples align closely over time.

11-month estimates exclude October data. 12-month estimates are unavailable for 2025.