Education Trust Fund supplemental revenue
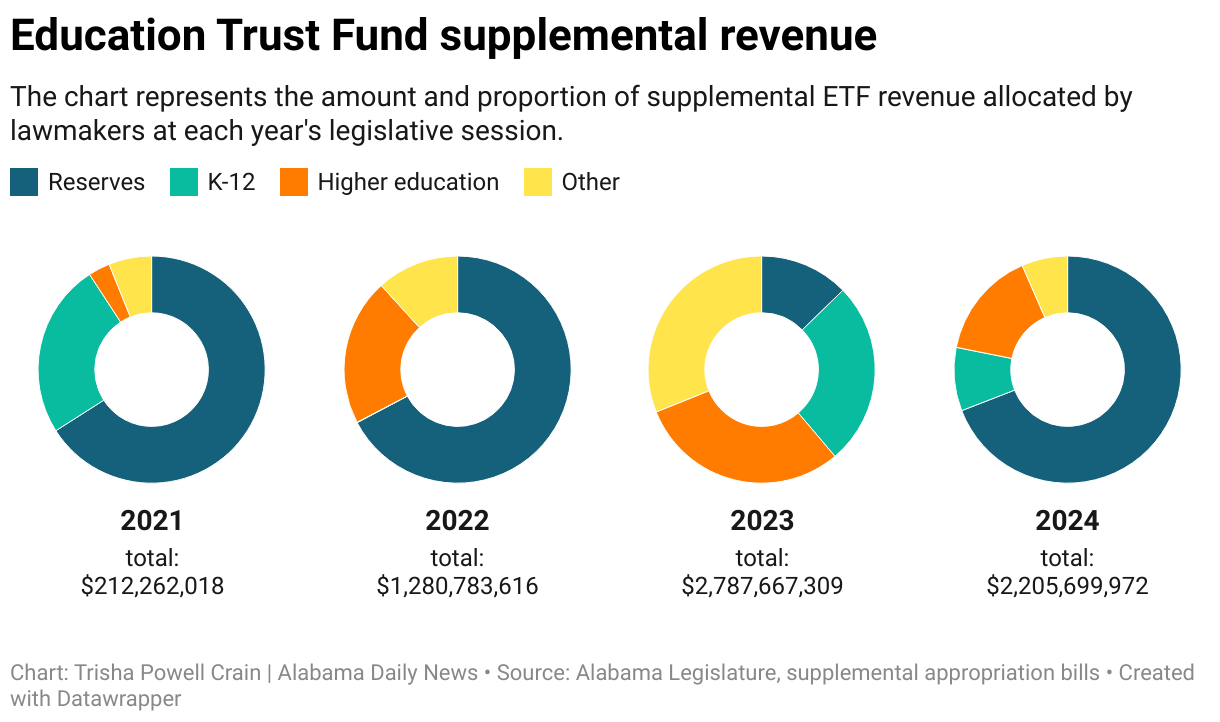
The chart represents the amount and proportion of supplemental ETF revenue allocated by lawmakers at each year's legislative session.
The chart represents the amount and proportion of supplemental ETF revenue allocated by lawmakers at each year's legislative session.
