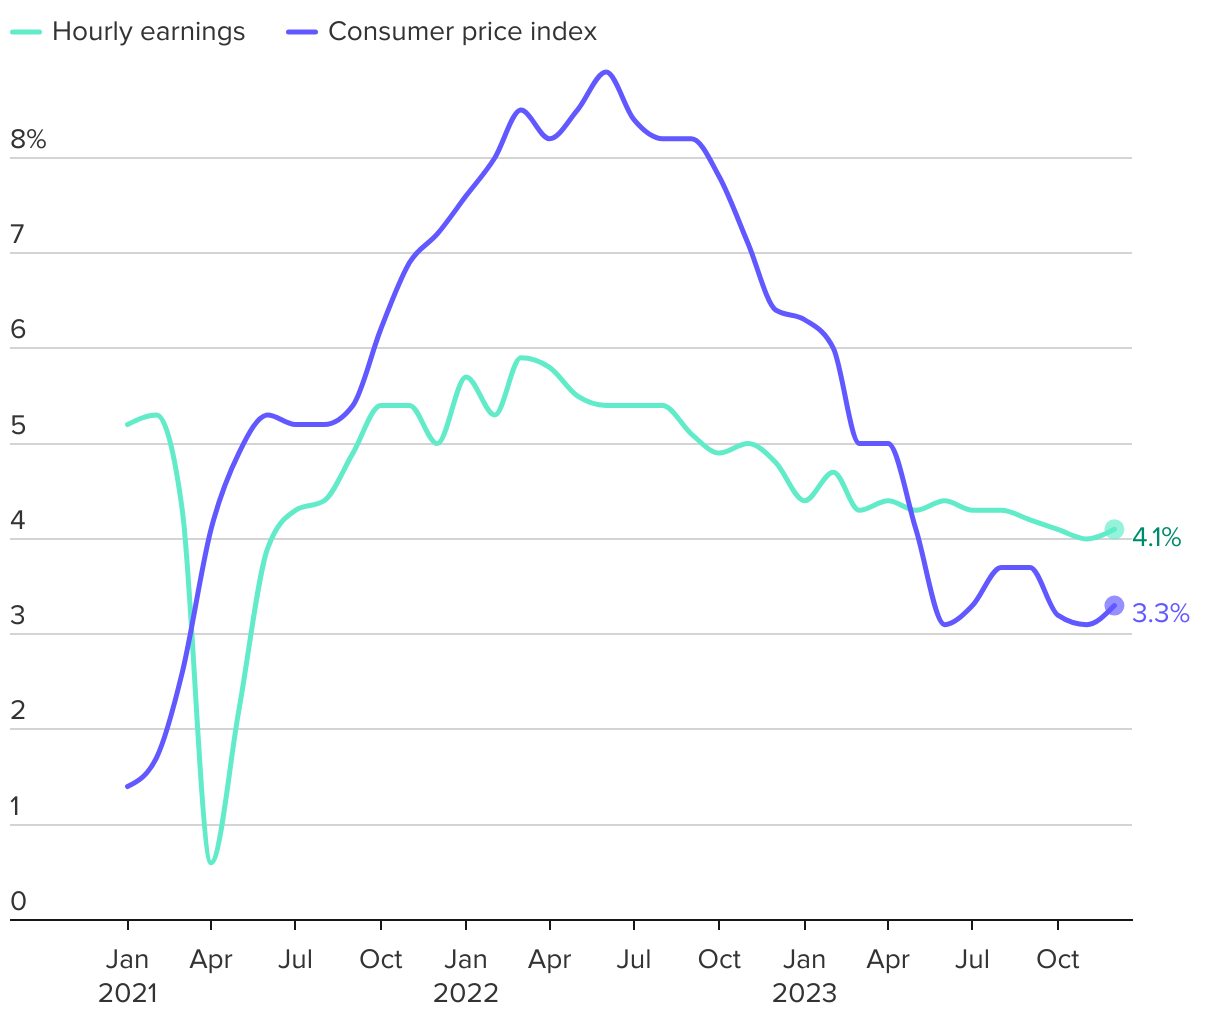
Average hourly earnings in the U.S. and consumer price index
Year-over-year percent change
The line chart shows the year-over-year percent changes in the U.S. consumer price index and average hourly earnings for U.S. workers from January 2021 through December 2023.