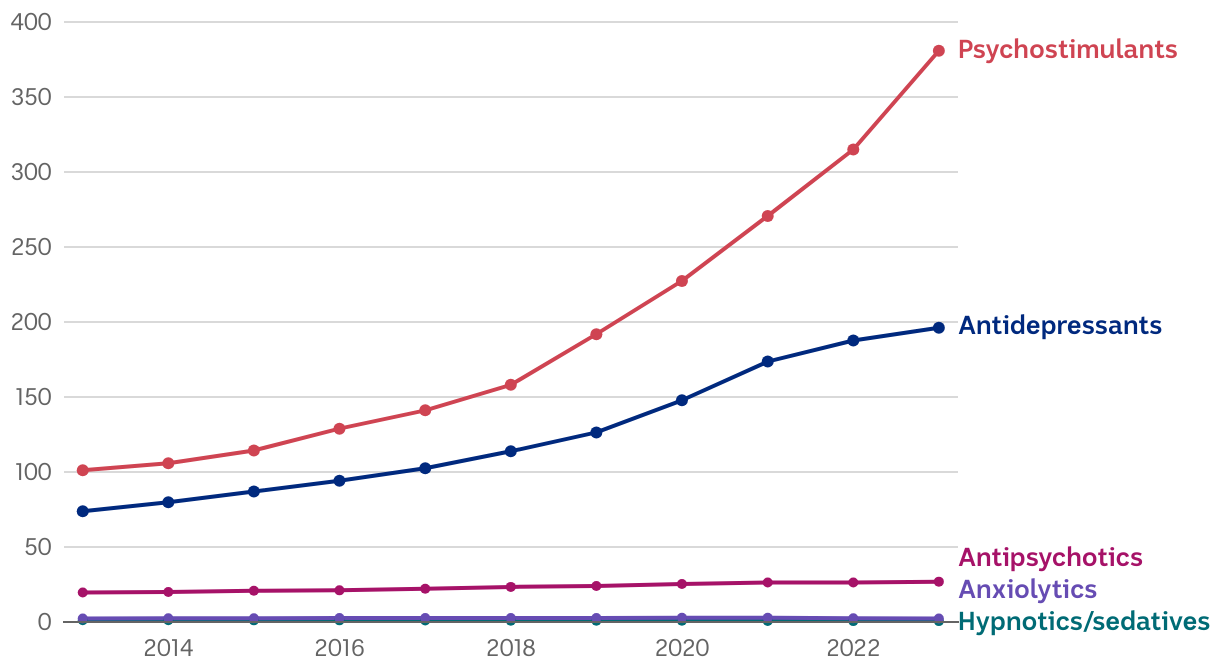
See how mental health prescriptions to children and teenagers have changed in 10 years

Chart shows rate of prescriptions per 1,000 people under 18 between 2013 and 2023. Rate calculated by (dispensed script count/population total as at 30 June) * 1,000. Data does not show number of patients.
Source: Department of Health and Aged Care Get the data