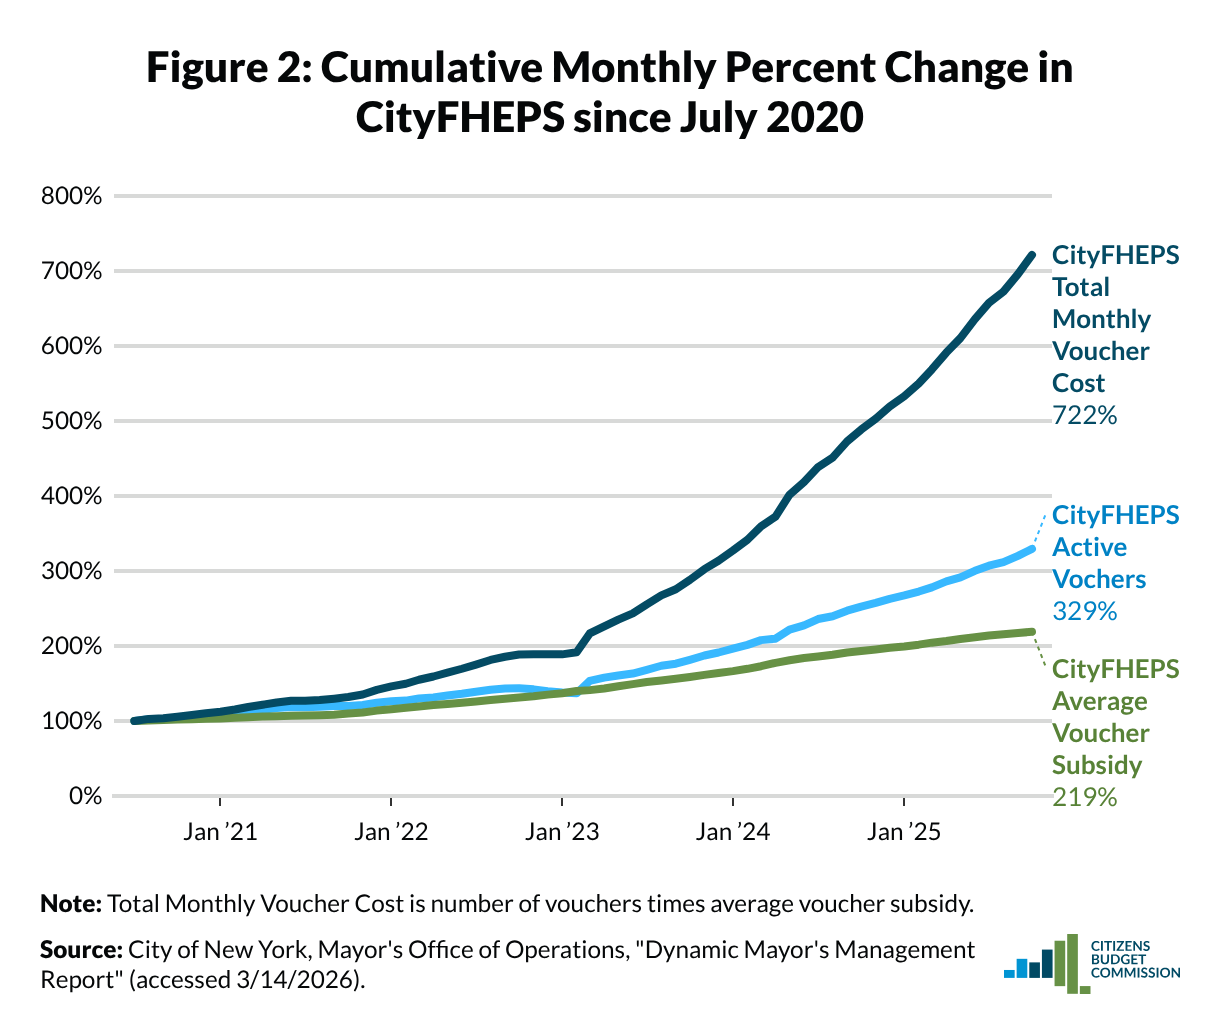
Figure 2: Cumulative Monthly Percent Change in CityFHEPS since July 2020
(Please use a modern browser to see the interactive version of this visualization)
