Medicaid enrollment soared during COVID-19 pandemic
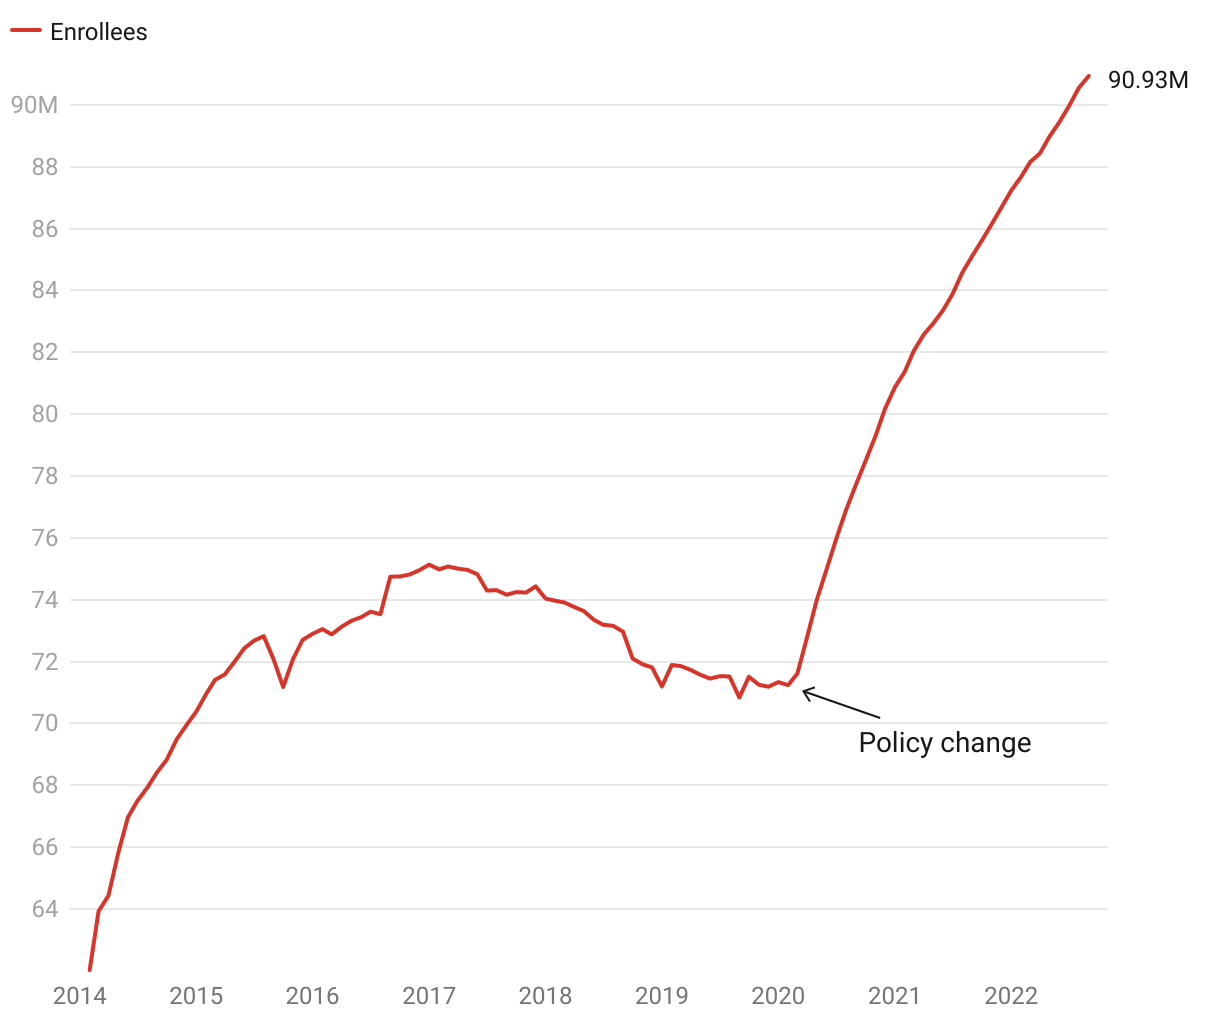
The number of Americans getting health insurance through Medicaid, a program for people with low incomes, grew by more than 25% between February 2020 and September 2022, at which point nearly 91 million Americans were enrolled in it. Temporary federal policies tied to the COVID-19 pandemic caused this swift growth.
Line graph showing growth spurts between 2014 and 2017 and again from 2020 through late 2022.