Greenhouse gas emissions across states and territories
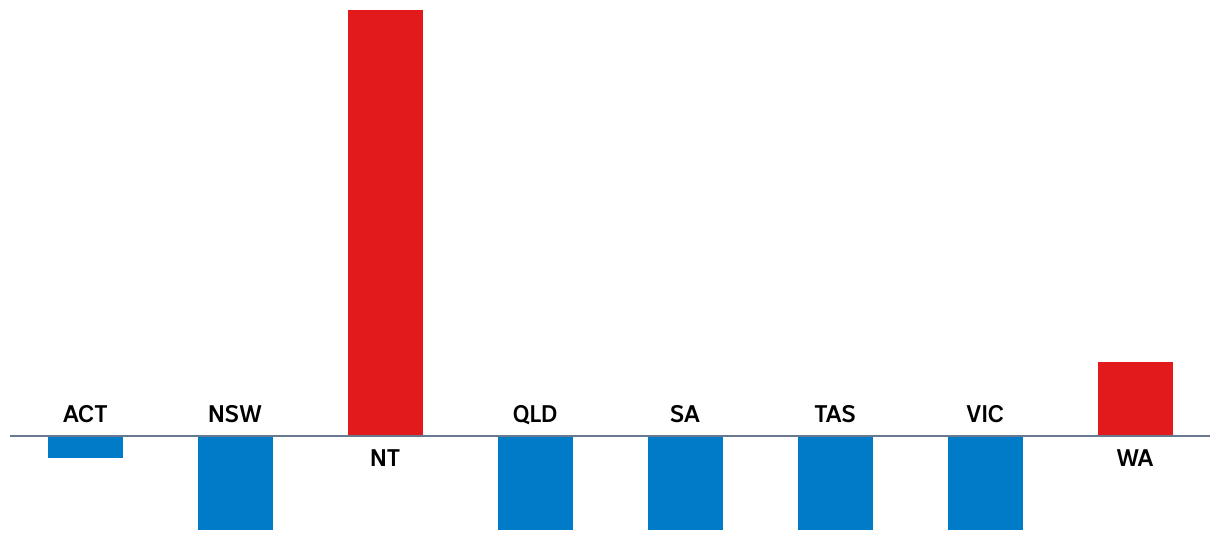
Every state and territory has seen a reduction to the percentage of emissions it produces, except for the NT and WA, with data from 2005-2023 showing emissions have risen by 98 per cent and 17 per cent respectively.
A graph showing emissions have gone down everywhere except for the NT and WA, where it has risen by 98 per cent and 17 per cent respectively.