Zillow home price forecast through Nov. 30, 2025
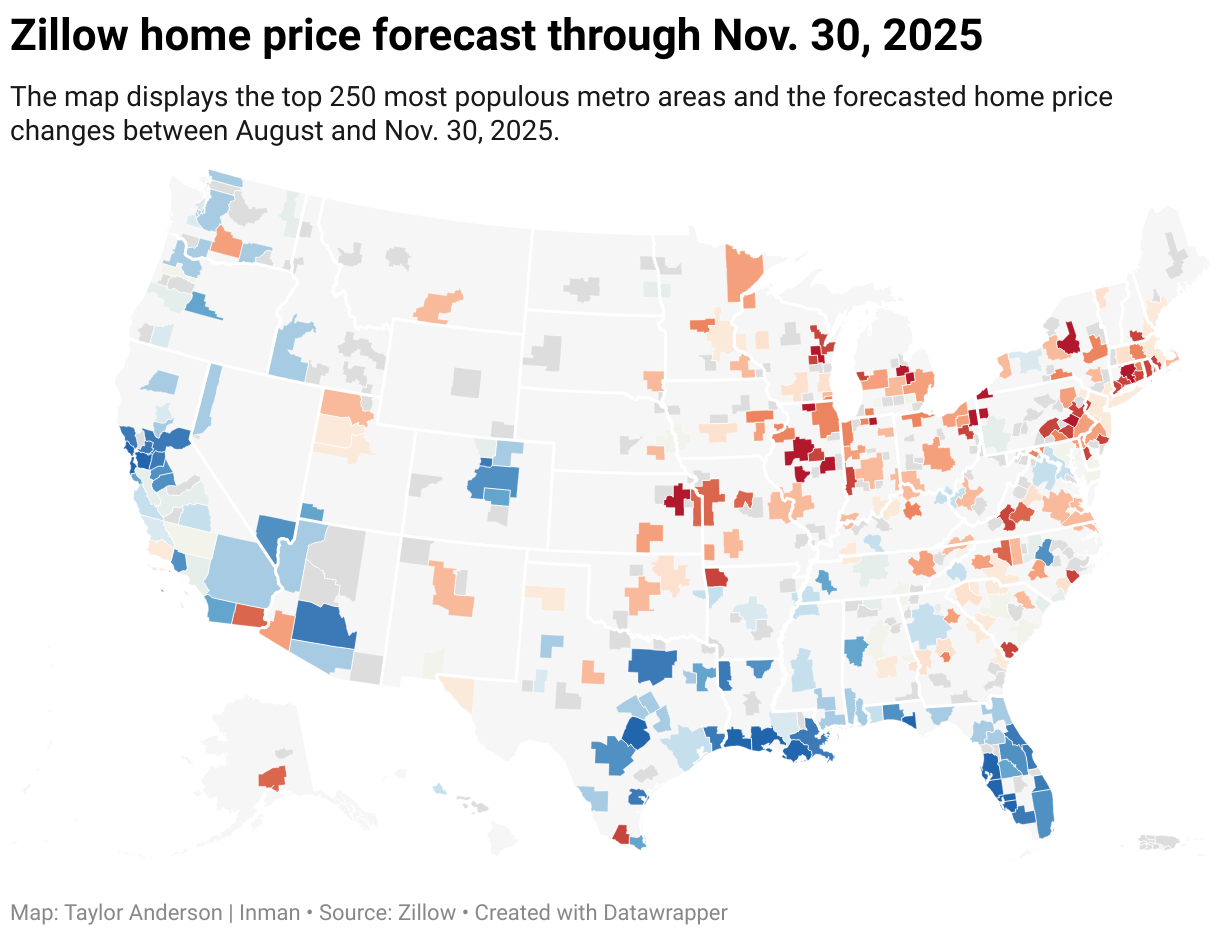
The map displays the top 250 most populous metro areas and the forecasted home price changes between August and Nov. 30, 2025.
The map displays the top 250 most populous metro areas and the forecasted home price changes between August and Nov. 30, 2025.
