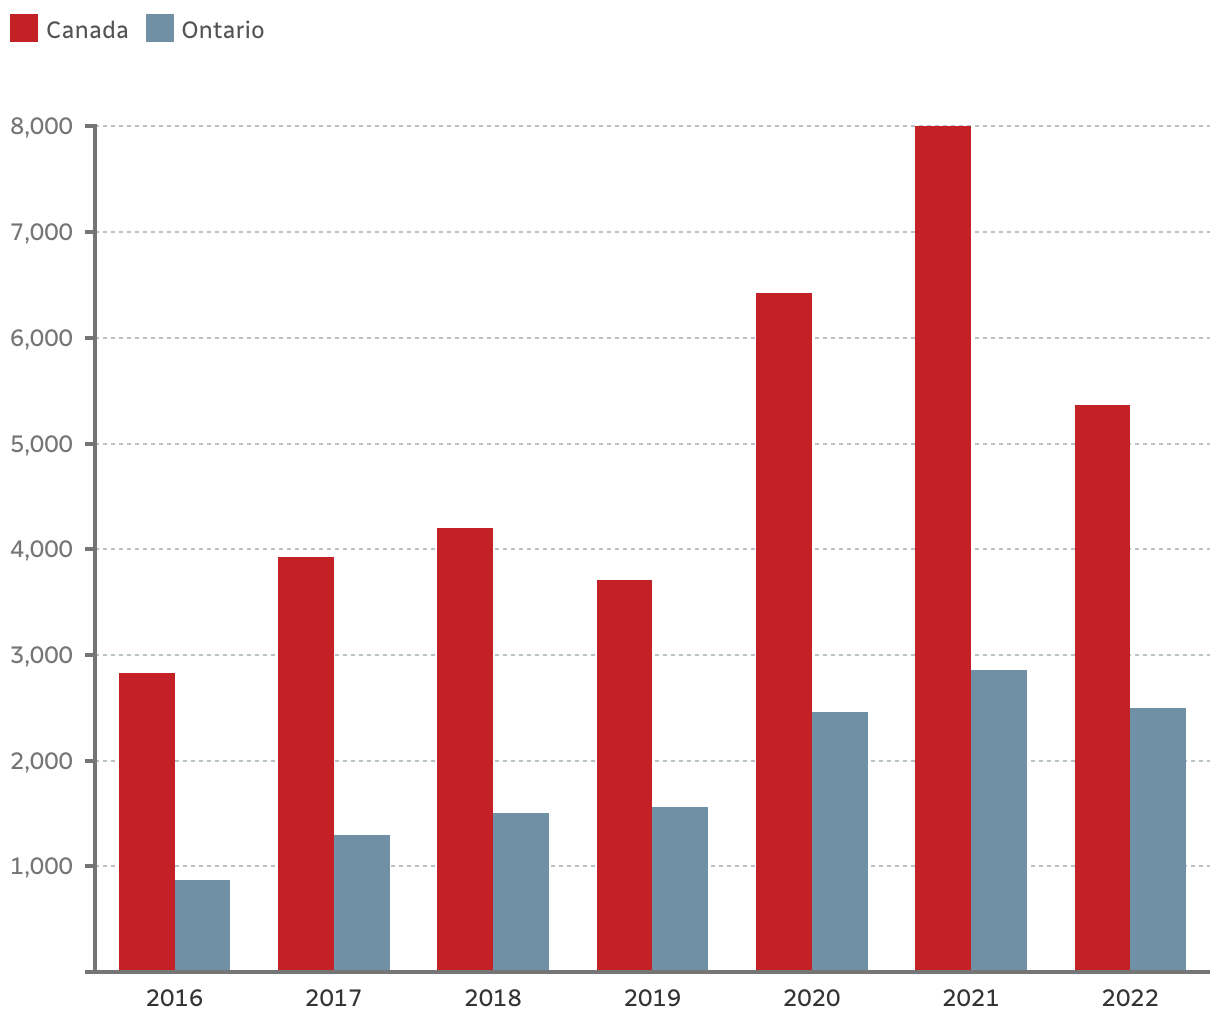
Total number of opioid-related deaths
A column chart from 2016 to 2022 with numbers two numbers group side by side for each year. The number of opioid deaths per year in Canada overall is coloured in red, and the number of opioid deaths per year in Ontario is coloured in black.