Not All States' Public Sectors Recovered From Great Recession
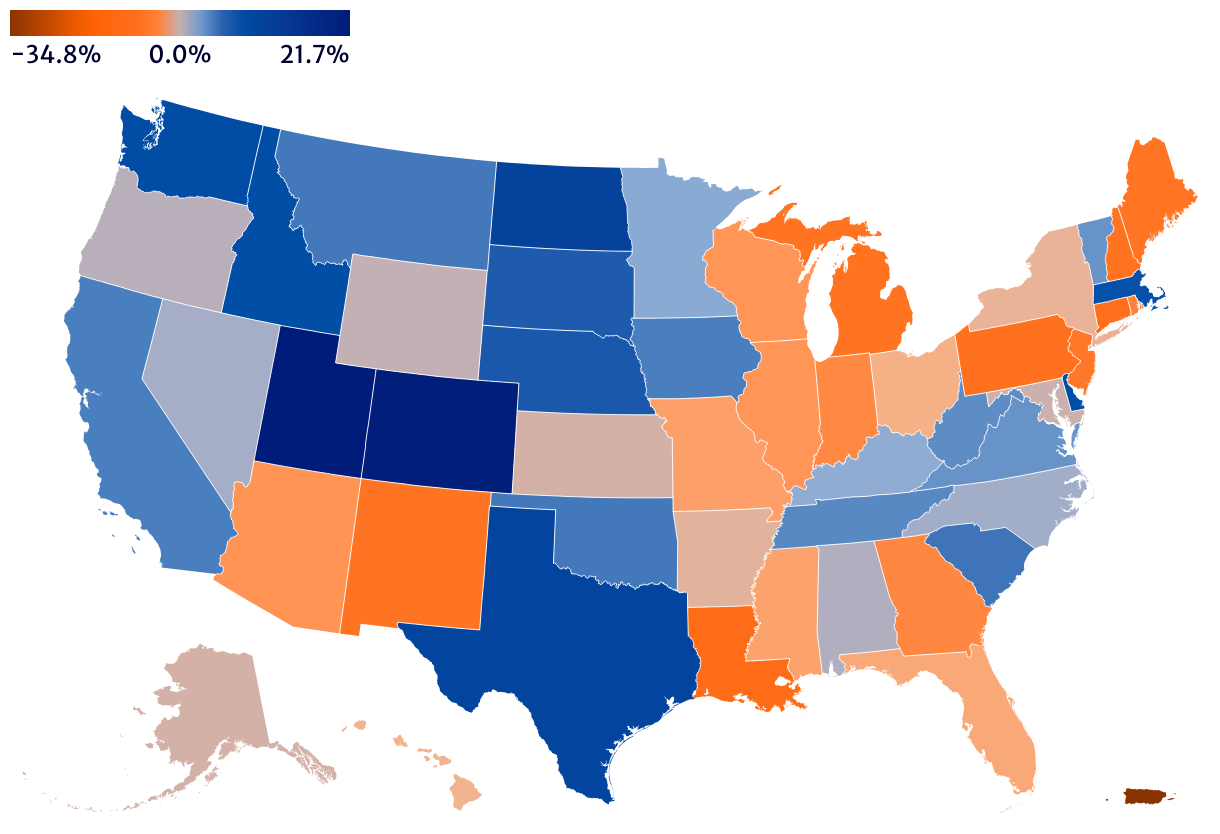
Percent Change in State and Local Government Employment, 2008–2019
This figure, Figure 3, shows the percent change in state and local government employment between 2008 and 2019 by state and territory. It includes information for the 50 US states, the District of Columbia, and Puerto Rico. States and territories that experienced an increase in their state and local government workforces are shown in shades of blue, with darker shades indicating a higher percent change. States and territories that experienced a decrease in their state and local government workforces are shown in shades of orange, with darker orange indicating a greater percent decline. Twenty-six states and the District of Columbia had larger government workforces in 2019 than in 2008; positive growth ranged from 0.2 percent in Wyoming to 21.7 percent in Utah. In the 24 remaining states plus Puerto Rico, state and local government employment declined between 2008 and 2019. Puerto Rico experienced the biggest shortfall, with a nearly 35 percent drop in those employed in state and local government.
Source: Authors' analysis of State and Area Employment, Hours, and Earnings data, US Bureau of Labor Statistics, 2008–2019.