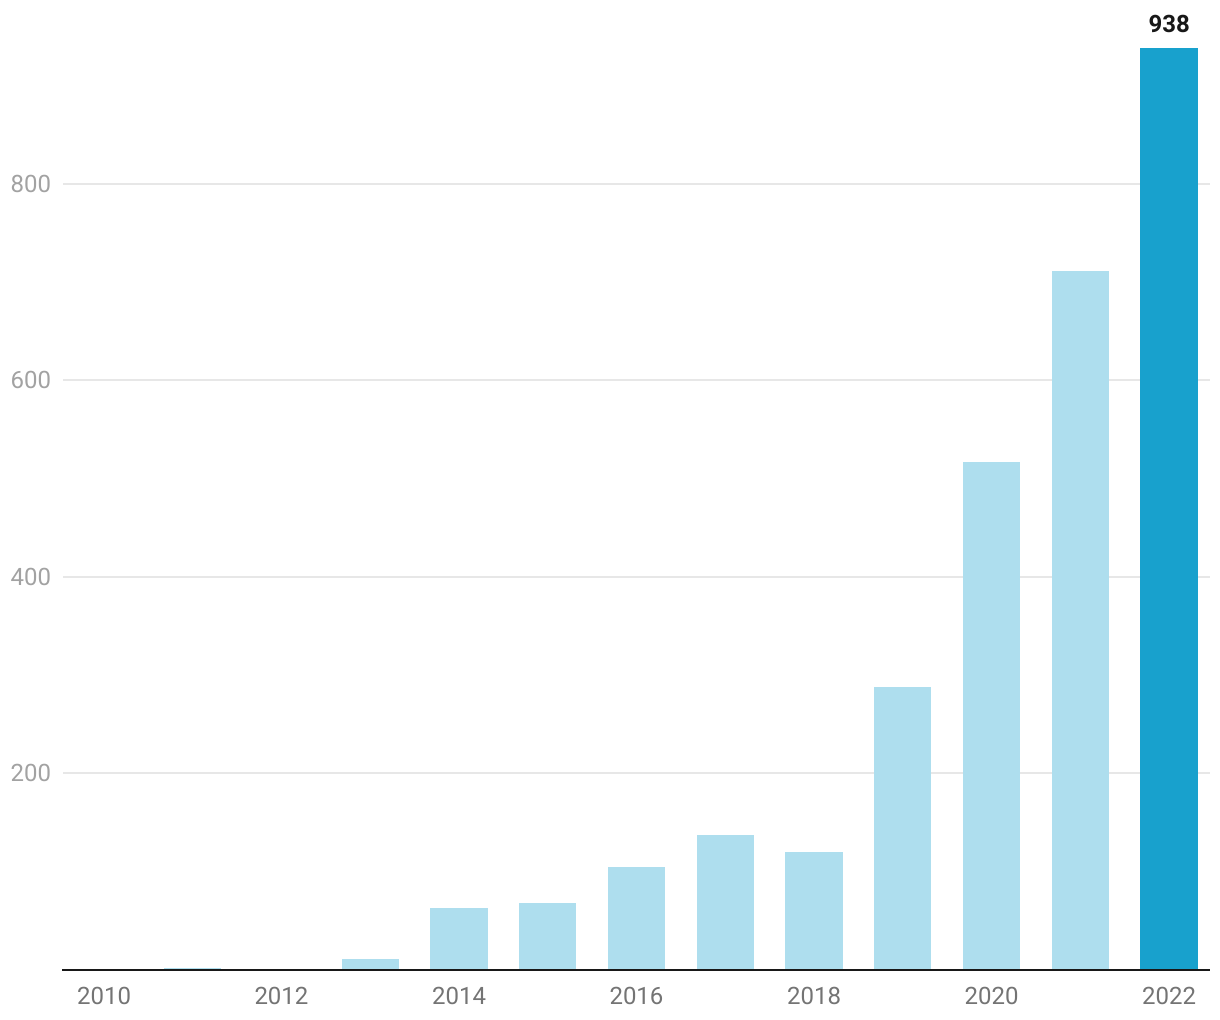
Total "Schedule A" cases, 2010-2022
The number of mass counterfeit lawsuits against e-commerce sellers filed annually in the United States.
A column chart showing the increase of the number of total Schedule A cases filed annually in the US from 2010 to 2022. The x-axis is the year, and the y-axis is the number of cases.