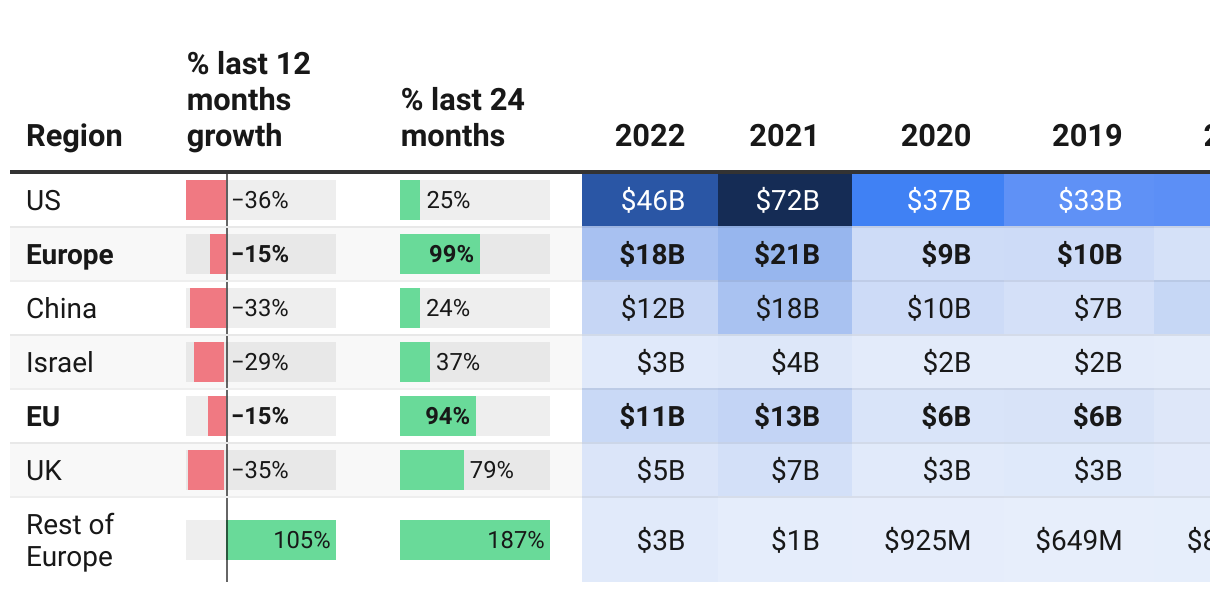
Deep Tech VC funding by region
This is a table and heatmap data showing global venture capital investment by industry vertical.
The table includes columns for the industry vertical, the percentage growth in the last 12 months, the percentage growth in the last 24 months, and investment amounts for the years 2018 through 2022. The data is sourced from Dealroom.co. The industries are listed in descending order of percentage growth in the last 12 months, with Energy having the least growth at -8.10% and Home & Living having the most decline at -65.00%. The heatmap displays the percentage growth in the last 24 months with darker shades indicating higher growth and lighter shades indicating decline. It can be seen that some of the industries such as Semiconductors and Legaltech had a positive growth while others such as Energy and Home & Living had a negative growth.