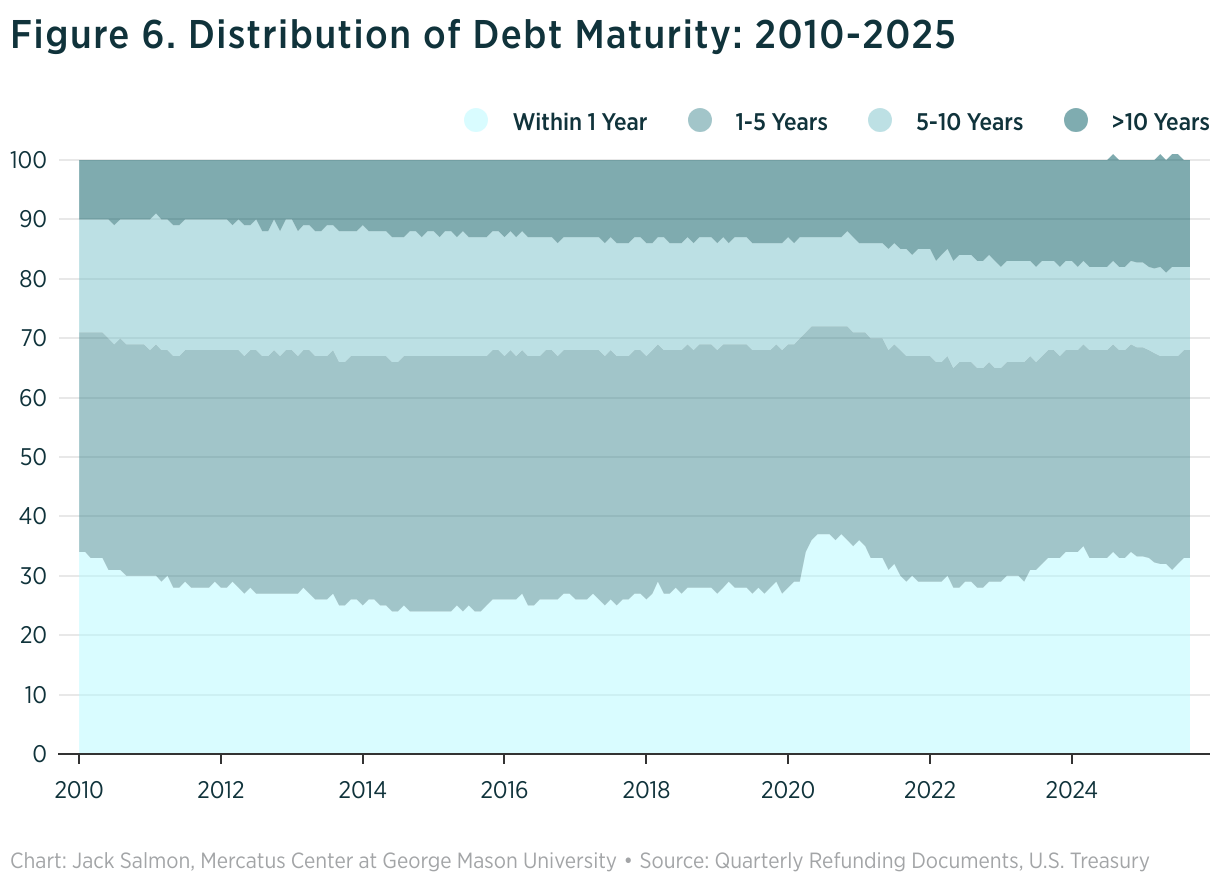
Figure 6. Distribution of Debt Maturity: 2010-2025
(Please use a modern browser to see the interactive version of this visualization)
