Combat Deployment and Deaths of Despair
Effect of 10-month deployment on suicide and drug or
alcohol-related mortality, relative to the average soldier
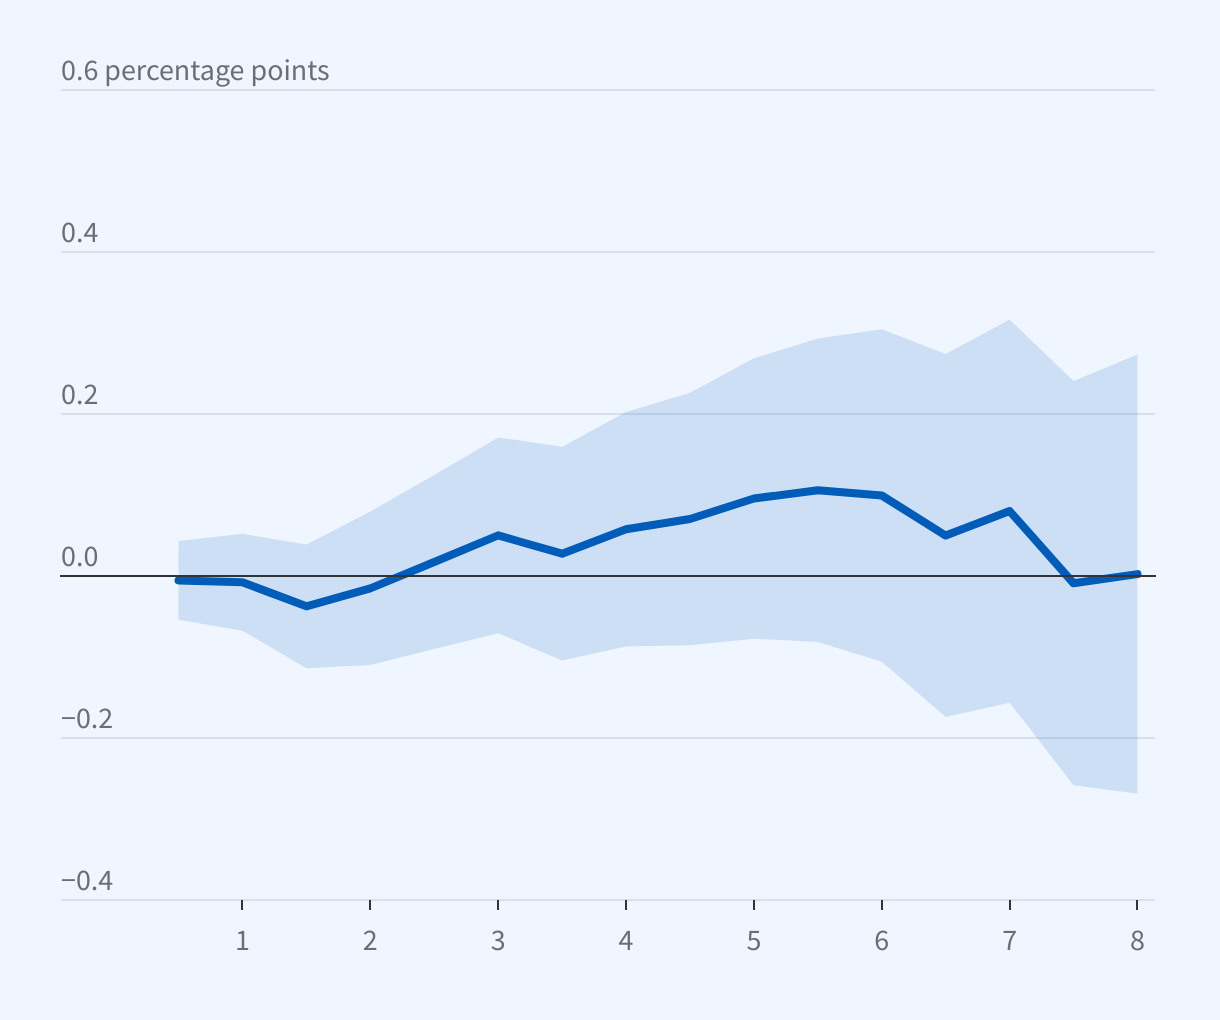
The graph is a line chart titled, “Combat Deployment and Deaths of Despair.”
The chart plots estimates of the effect of a 10-month deployment on suicide and drug or alcohol-related mortality, relative to the average soldier.
The y-axis ranges from -0.4 to 0.6 percentage points, and the x-axis ranges from 0.5 to 8 years since deployment.
The estimates, which range from -0.04 to 0.11 percentage points, are not statistically significantly different from zero.
Source: Researchers' calculations using Army personnel records and administrative data