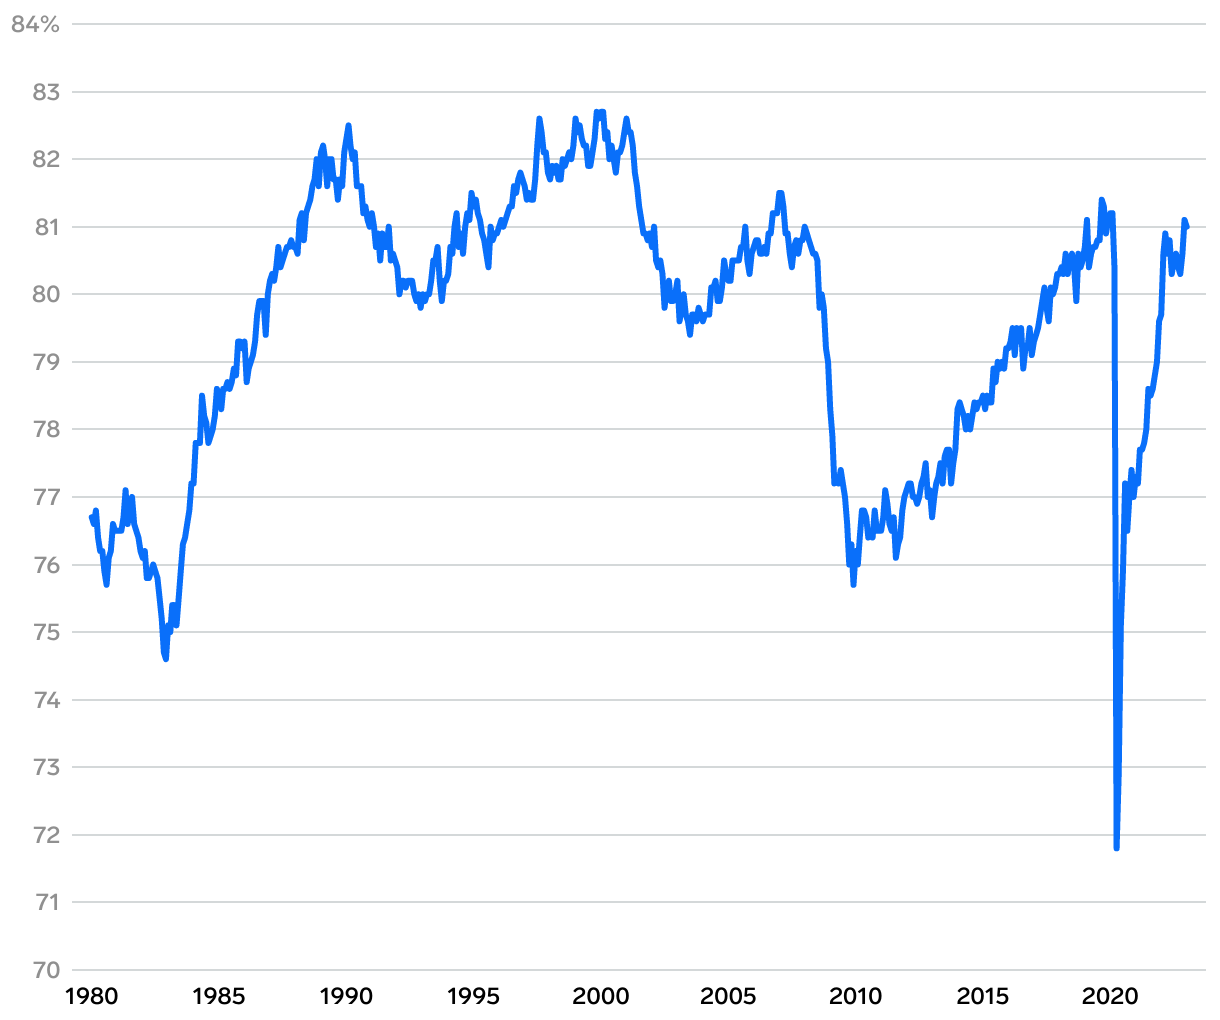
Employment-population ratio for 35 to 44 years old
Line chart showing employment-population ratio for 35 to 44 years old since 1980.
(Please use a modern browser to see the interactive version of this visualization)