Income tax helps offset Ohio's upside-down tax code
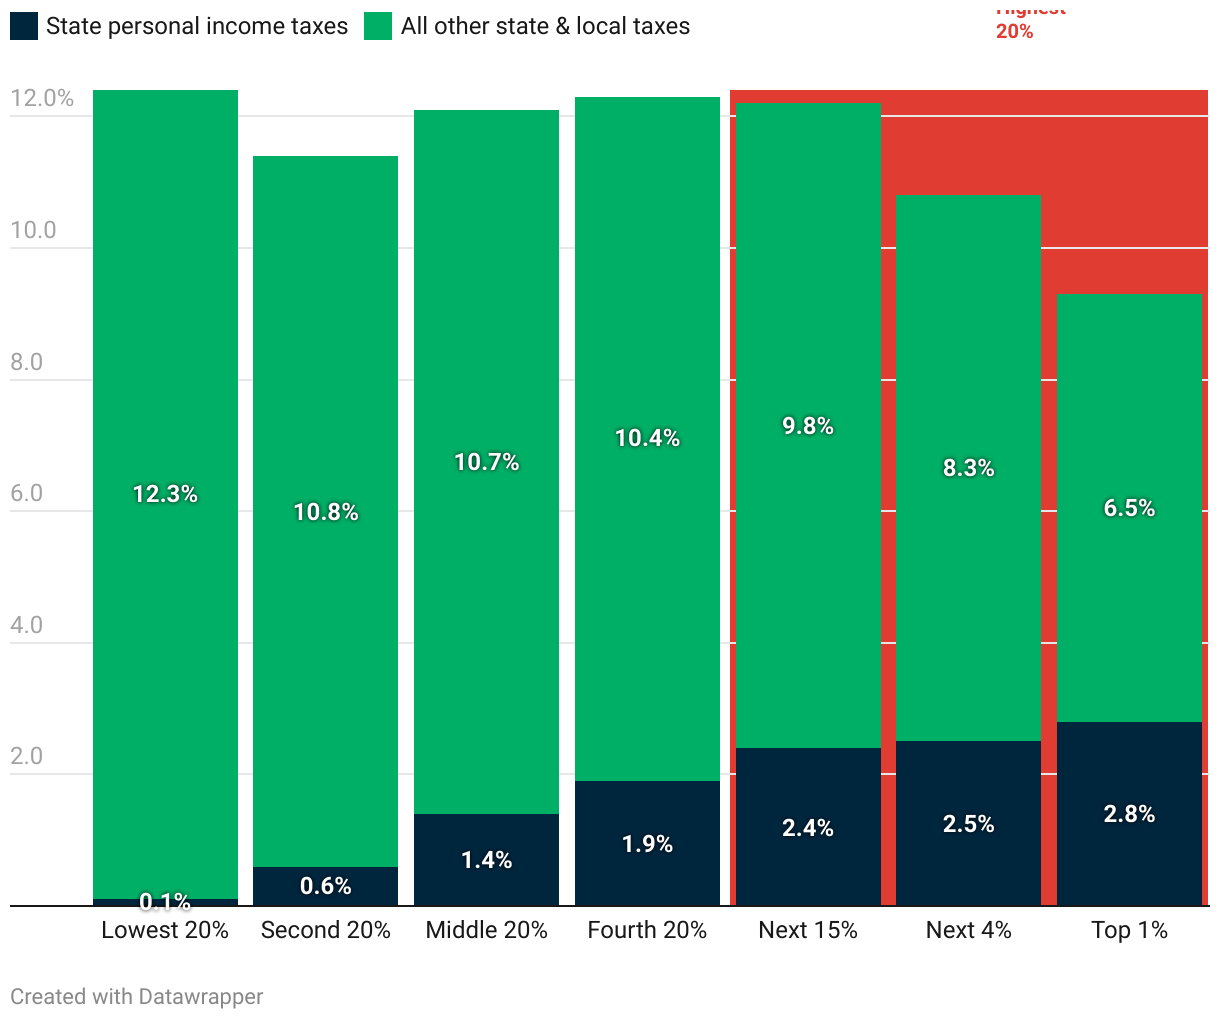
Total state & local taxes as a share of income, by income group
A bar chart showing the share of income paid in state personal income taxes and all other state and local taxes. The data are broken up by income group. The chart shows how the income tax makes Ohio's tax code more equitable, but all other taxes weigh more heavily on people with lower incomes than they do on people with higher incomes.