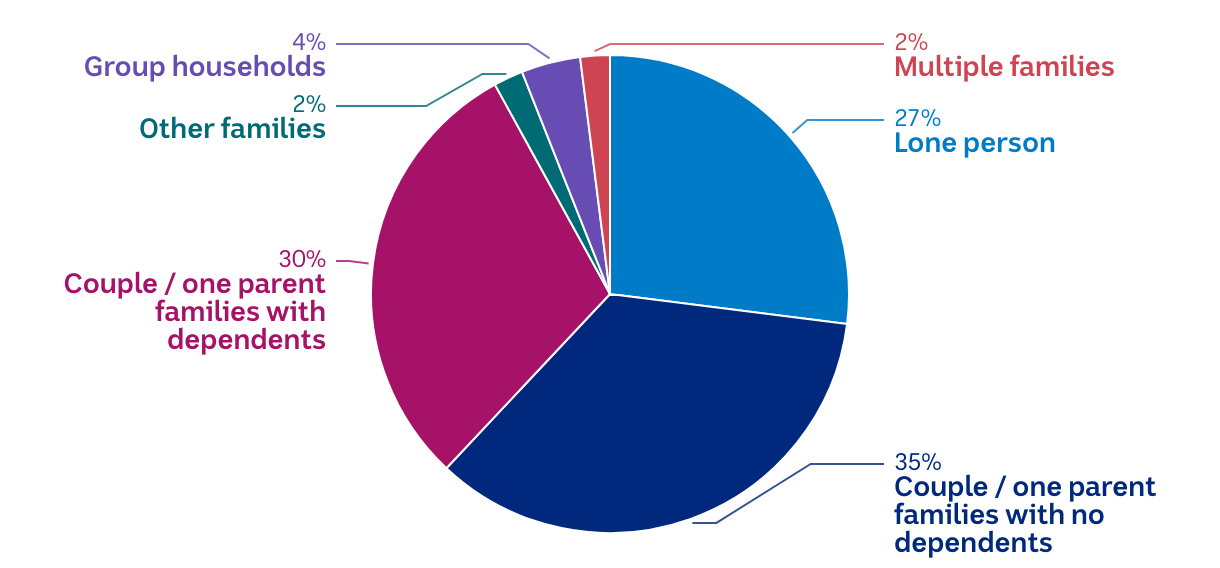
Composition of households by type, July 2025
A pie chart shows the proportion of Australian households by composition, the largest slice is couple/one-parent families with no dependents, followed by couple/one-parent families with dependents, then lone person, then group households, other families and multiple families.