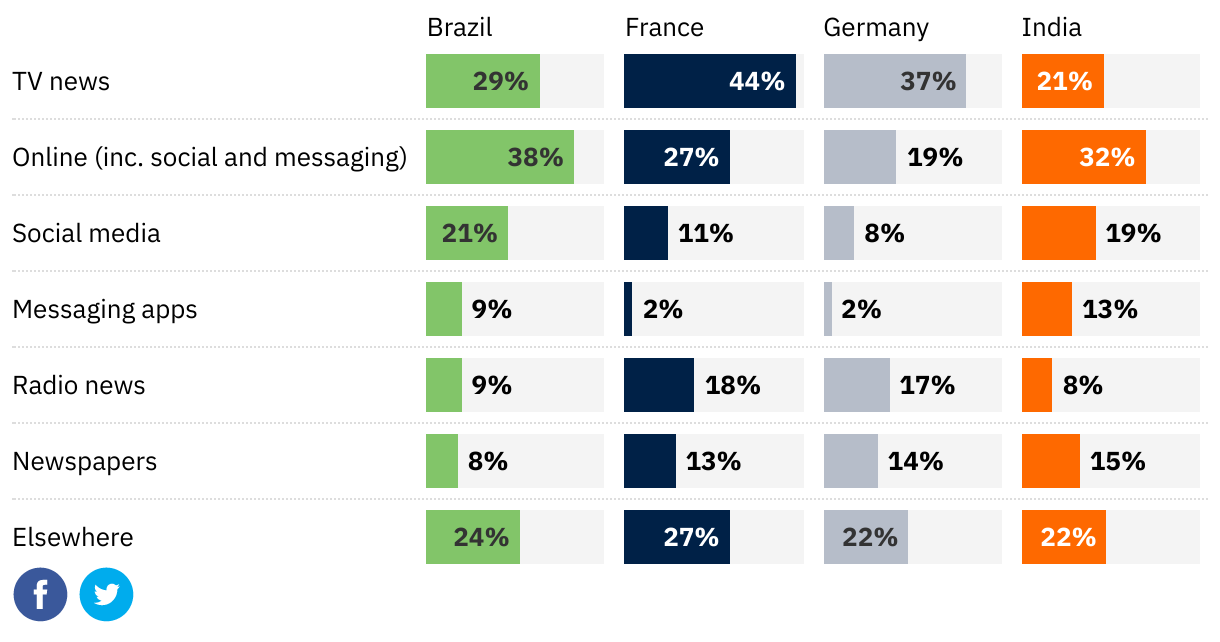
Figure 2. Proportion that saw/heard climate change news or information from each in the last week
(Please use a modern browser to see the interactive version of this visualization)