Civil servants who are female, senior civil service and all civil servants, 1997–2025
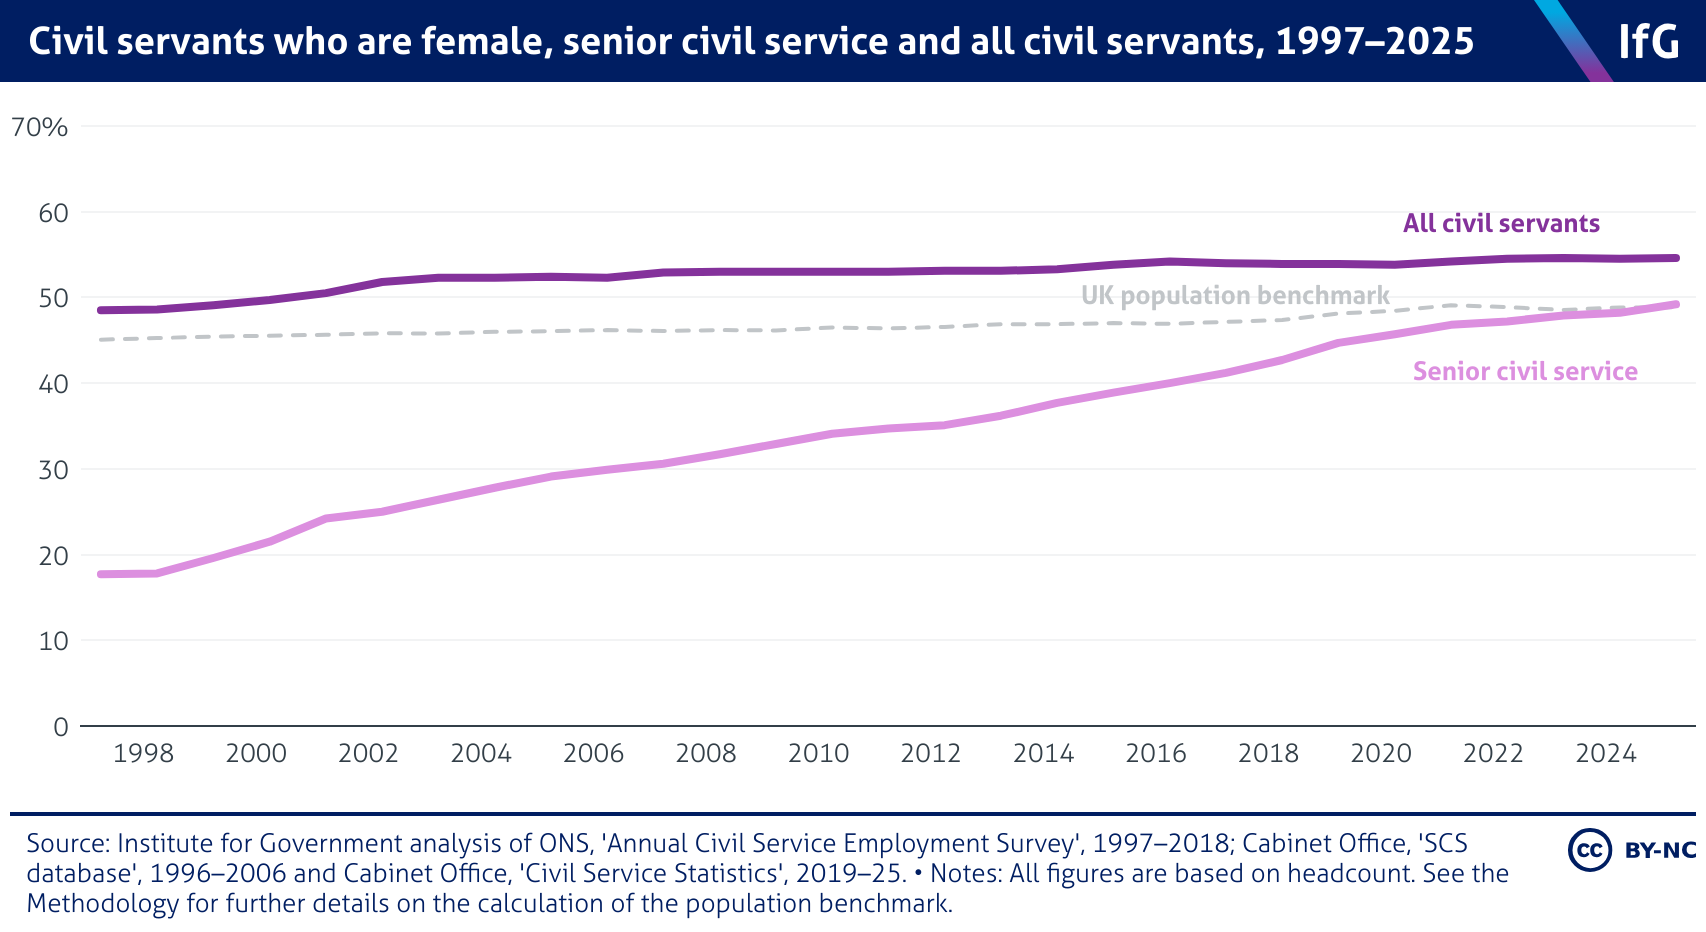
A line chart from the Institute for Government showing the proportion of civil servants who are female in the senior civil service and all civil servants, 2016-25, showing that the share of female civil servants is higher in the whole civil service than in the senior civil service throughout the entire period. The whole civil service is consistently above the population benchmark.

